|
by Miceal O'Ronain (
Abstract On On
In an interview, given to an Alaskan news paper, the Director of the Alaska's "Center for Global Change and Arctic System Research", made contradictory statements about the information provided to the New York Times, citing differing times periods for the confusion and appeared to support a temperature increase of "about 2-3 degrees F" for the time interval reported by the New York Times. It will be shown that the two sources referenced by the New York Times are in fact very closely affiliated through the United States Global Change Research Program and that the New York Times, used an invalid statistical technique to extract their Alaskan temperature information from a seriously flawed graphic, published by that federal agency, which reported to show the Annual Average Temperature for Alaska during the 20th Century. Introduction In a story titled "Alaska, No Longer
So Frigid, Starts to Crack, Burn and Sag" [1], Timothy Egan
of the New York Times, reported on Since the 1980's, Dr. Sue Ann Bowling has been tracking an unusual
Alaskan temperature event known as the Great Pacific Climate Shift which
occurred from1976 to 1977 and maintains a graph at "The FANB temperature
record" [4]. Dr. Bowling's
graph, which averages the annual temperatures for the weather stations at While ignoring the ACRC Response and faced with mounting
questions, the New York Times had to find an Alaskan Climatologist to support their
story. Apparently they were unable to locate anyone who would corroborate their
7°F temperature increase. On
The ACRC [5] scientists posted an Update Response on July 12, 2002 in which they stated: "We still find the value of 5.4°F too great by a factor of 2 for the 1971 to 2000 period, the last 30 years". In the update response, it was noted that the New York Times might be referring to another time period; however, given that the Times was very explicit on several occasions about the time interval, that appears to be unlikely. On July 19, 2002, the Anchorage Daily News, in their "Voice Of The Times" section carried an interview with Dr. Gunter Weller, Director [9] of the "Center for Global Change and Arctic System Research" [8], which was titled "Global Warming Debate Involves . . . Dueling digits" [10]. Reading the interview several times, I found myself totally confused; however, I suspect that the reporter and Dr. Weller were equally confused. During the interview, several of items of interest immerged: a) The CGC "told The New York Times that annual mean temperatures increased 5.4 degrees in Alaska between 1966 and 1995", not the period from 1971 to 2001 reported by the Times. b) "Weller says his numbers
differed from those of the c) According to Weller "the strongest warming trend has shifted from Alaska into Northern Canada and the warming trend for most of Alaska . . . is now about half of the 1966-1995 value, or about 2-3 degrees F." The temperature increase of 5.4°F for period from 1966 to 1995 is not credible. While 1966 was a cold year, the three years immediately following, were unusually warm for pre 1976 conditions. Using the four stations referenced by the ACRC and the CGC in some of their reports, and applying the same linear trend analysis used by the ACRC, the temperature increase from 1966 to 1995 was 2.89°F. Even if an invalid technique, such as taking the absolute difference of the averaged annual mean temperature is used, the increase is only 4.66°F. The only way to obtain a temperature increase of 5.4°F for the period from 1966 to 1995 would be to select a pair of unusually cold and warm years and take the absolute temperature difference. The application of any legitimate statistical technique, yields values similar to those reported by Dr. Bowling [4]. The second statement in the
interview is equally questionable, because the Great Pacific Climate Shift of
1976 to 1977 had such a profound impact in Alaskan temperatures that unless you
use a limited set of data about the inflection point (1976-1977) most
statistical techniques will only see the inflection point. Dr. Weller's third
statement is the most puzzling of all, because raw temperature records are a
matter of historical fact and not subject to change. By implication Dr.
Weller's appears to be indicating that (1) The question remains, exactly where did the New York Times obtain the 7°F temperature increase for the last thirty years and was the 5.4°F increase obtained from the CGC or other sources? The Temperature Data Before we continue, it should be noted that the Alaskan temperature data used in this report, was obtained from two sources. The "Alaska Climate Summaries" [11], which is part of the "Western Regional Climate Center" [12]. This facility is one of the network of NOAA "National Climatic Data Center, Regional Climate Centers" [13] which offers on-line access to climate data. The second source for Alaskan temperature data was NASA's "Goddard Institute for Space Studies, Surface Temperature: Station Data" [14], who's datasets extend back to the 1930's. Using the temperature values from the "Alaska Climate Summaries" [11], the calculations of the ACRC were verified. Calculations and graphs appearing in this report were created. Microsoft Excel 2002 was used to manage the data, perform calculations and create graphs. The Investigation A search of the climate alarmist literature on the Internet identified several possible sources for the numbers cited by the New York Times. Unfortunately, none of the apocalyptic scenarios quite matched the conditions in the Times story and none of the stories could be matched with a credible scientific source. There were three facts which the New York Times cited about their source: a) The time interval for both temperatures was a 32-year period
between 1970 and 2001. The 1978 date is significant because it is immediately after the Great Pacific Climate Shift of 1976 to 1977, when sea ice did not yet have time to respond to the sudden increase in temperature. The mid-1960's coincides with unusual cold temperatures, when climate alarmists were selling global cooling and the coming of the next ice age. In the climate alarmist industry, the selection of dates is everything. Also, the Times cites a "federal report" as the source of their information. So the key question is, what is it about the early 1970's which makes it so very interesting to the climate alarmist industry? And, exactly which "federal report" was the New York Times using? The source of the 7°F temperature was difficult, because it is not reported in the literature. The key clue here was the "federal officials" and the "federal report" sighted in the comments pertaining to sea ice. Finally we come to the "Center for Global Change and Arctic System Research" (CGC) [8]. According to the home web page of the CGC, their major research project through the end of 1999 was the writing of the report "The Potential Consequences of Climate Variability and Change" [15], for the "Alaska Regional Assessment Group" [17] of the "U.S. Global Change Research Program" [16], which was issued in December of 1999. The Alaskan report was then included the "US National Assessment of the Potential Consequences of Climate Variability and Change" (USNA) [18] was issued in 2000 and contained a regional section devoted to Alaska, "US National Assessment of the Potential Consequences of Climate Variability and Change Mega-Region: Alaska" [19]. In the last two years, there have been three significant United States Government reports on climate. These were: a) "U.S. Climate Action Report - 2002" [2]. b) "Climate Change Science: An Analysis of Some Key Questions" [21]. c) "US National Assessment of the Potential Consequences of Climate Variability and Change" [18]. The EPA's "U.S. Climate Action Report" undermines
the New York Times story by stating that The question is, can the 7°F and 5.4°F temperature increases for Alaska be found in either of the CGC or USNA reports? It should be noted that 5.4°F is a very strange number for climate alarmists, because they do not like to be give specific numbers for which they can be held accountable. Terms such as about the 1960's or about 7°F are quite common, but 5.4°F caries quite a bit of numerical authority and implies a verifiable source. While 5.4 degrees is a strange number in the Fahrenheit scale, it happens to be exactly 3 degrees in the Celsius scale. Recognizing the predictability of climate alarmists, let's expand the search to three temperature values of 7°F, 5.4°F and 3°C. Let's search the two documents in the order in which they were published, beginning with the CGC report. Investigation of the
CGC Report on The CGC's report is published in sections as a series of PDF documents at "The Potential Consequences of Climate Variability and Change" [15]. Searching these PDF documents, on page 6 of "Preface and Executive Summary" [15.1], is contained a figure with the follow description: (Fig. 1) "The Alaskan regional Climate and climate-related trends in Alaska, b) annual mean temperature composite from Anchorage, Fairbanks, Nome and Barrow". The following narrative accompanies the graphic: Observed Climate Trends Note the statement "with a rise in average temperature of about 5°F (3°C) since the 1960s". There was a significant rounding error made in converting between Fahrenheit and Celsius. Should the caption read "5.4°F (3°C)" or "5°F (2.78°C) "? Fig. 1b, is expressed in degrees Celsius, not degrees Fahrenheit, and both the New York Times and the Anchorage Daily News make reference to 5.4°F, it is a reasonable assumption that the correct temperature is 3°C, which was converted to 5.4°F and then truncated to 5°F in the CGC report. The New York Times attributed the 5.4°F increase to the last 30 years beginning with the 1970's, Dr. Weller in his Anchorage Daily News interview stated that he was talking about the period from 1966 to 1995, while the CGC report appears to imply the period from 1961 to 1998. Let's examine Fig.1b of the temperatures in which we are interested, using an expanded image with a white background:
Figure
1b: The Alaskan regional Climate and
climate-related trends in Note: The temperature value for 1993 in Fig.1b is inconsistent with the values calculated from both the NCDC and GISS datasets. The CGC value for 1993 is -2.5°C, the NCDC value is -1.97°C and the GISS value is -1.90 °C. Temperature change scales of 5.4°F (3°C) was superposed at 1961 and 1966 and scales of 7°F (3.87°C) at 1964 and 1971. For 1961, a temperature delta of 5.4°F (3°C) lies between the minimum and maximum temperatures in range from 1961 to 1998, which is clearly the time interval referenced by the CGC report. However, using minimum and maximum temperatures to calculate the temperature change is not a valid statistical methodology. Using linear regression analysis, for the interval from 1961 to 1998, yields a temperature increase of 3.46°F (1.92°C). For the interval from 1966 to 1995, the absolute difference in temperature between the two dates is 4.66°F (2.59°C) and liner regression analysis of the interval yields a temperature increase of 2.74°F (1.52°C), which is only half the value reported by Dr. Weller in his news paper interview. Using linear regression analysis, it is impossible to obtain the temperature increase reported by the CGC. In point of fact the only way to obtain a temperature change of 5.4°F (3°C) from Fig.1b is to take the difference between the maximum and minimum limits. While an absolute temperature increase of 7°F (3.87°C) can be derived by using 1964 as the starting point, the New York Times explicitly stated that their time interval was from the 1970's. Using the CGC graph, with 1971 as the minimum temperature point, it is impossible to derive a 7°F increase and we have to look else ware for it source. If the annual mean temperature for 1993 had been in agreement with the NCDC and GISS values, the difference 1971 and 1993 would have been 7.07°F but the CGC and NYT missed that opportunity for anthropogenic global warming. Before USNA report is investigated, there is one very
interesting feature about Alaskan climate which should be reviewed. In a paper,
by Stafford et al. [20] Fig.2 shows a contour map for the
mean annual temperature for the State of The Thawing of The
property of water to change phase at 32°F (0°C) is probably the most important factor in the observed
and expected climate impacts in In addition to the quality of the station's temperature
data, one of the primary reasons that Alaskan climatologists use the widely
dispersed stations of In summary, the New York Times temperature increase of 5.4°F is derived from Figure 1B of the CGC report but the value is for the wrong time interval, the CGC used a flawed statistical method to calculate warming. Compared to the results obtained using liner regression analysis, warming is overstated for the time interval by 170% to 200% depending on which stating and ending dates are selected. Investigation of the
USNA Report on The USNA section for
The equivalent subsections in the Overview HTML [19.1] and Overview PDF [19.2] contains the identical text, which follows:
We now have so many conflicting numbers for Alaskan
temperature change, that a score card is needed. But just wait; there are more
numbers to come. In addition to the narratives, this subsection also contained
two graphics which showed "
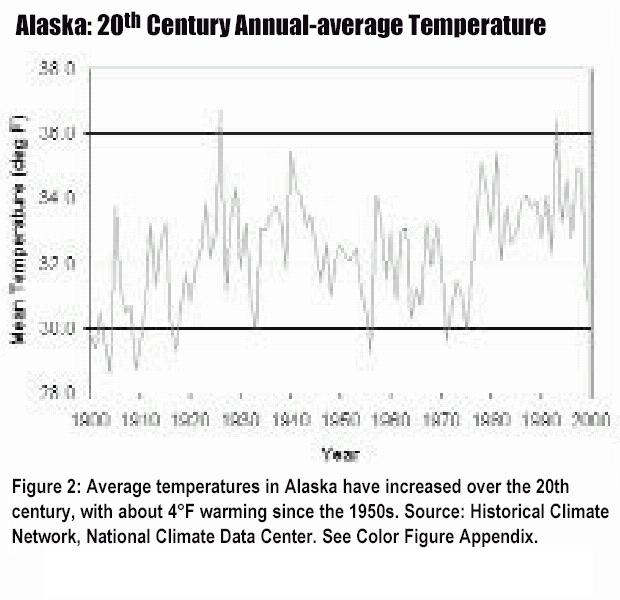
This graphic is extremely difficult to read. Based on an
examination of the graphic and its defects, it appears that it may be the
result of a
After the image was created in its current form, someone went to the trouble of
redrawing the grid lines at the 30°F and 36°F tick marks. With the exception of
where the temperature graph crosses the grid lines, the pixels are all the
exact same shade of black. Given the poor quality of the graph, the only way
that this could have occurred is through manual editing. Why were only these
two grid lines added? The grid lines were added to create the impression that
during the 20th Century Alaskan warming was more than 6°F. On this
graph, there are four dates which would be of interest to climate alarmists:
1956, 1964, 1971 and 1993. We can see why there would be interest in the 1950's
or 1960's as a starting reference, but as the subject of this report is the New
York Times story, let us focus on the last to dates of interest: 1971 and 1993.
With the help of the added grid lines, it would appear that the absolute temperature
difference between 1971 and 1993 was tantalizing close to 7°F. There are five
versions of this graph in the USNA which are documented in the References
" The graph which the CGC submitted to the USNA in December of
1999 covered the period from 1954 to 1998 and used the NCDC datasets for The following image was extracted from Color
Figure PDF [19.4] appendix page 1, after the PDF
image was expanded 260% and digitally enhanced to improve readability. The
image was then edited to highlight the suspected area which the New York Times
used to derive their 7°F temperature increase for
By counting pixels, it was determined that the absolute
difference between the annual-average temperature for 1971 and 1993 was 6.83°F.
The only way that the New York Times could have reported a temperature increase
of 7°F the last 30 years, was to perform the above calculation and then roundup
the value to 7°F. When the New York Times was challenged about the source of
their first temperature, they had to come up with a new value. The New York
Times would have assumed that the Alaskan CGC was the source of the graphic
which they used. As was previously noted, the graphic which was submitted to
the USNA, was replaced when it reached This report might have ended here if it were not for one
small detail about the " The annual-average temperature graph for As was previously noted, the average mean annual temperature
for the entire State of As was already discussed, all of the versions of this graph were of extremely poor quality, compared to other graphs in the USNA report. Given the many problems with this graph, the question begs to be asked, were the readability issues deliberate or just the very sloppy application of technology? What is contained in this Alaskan graph which the USNA wouldn't want attention called to? Observations about the " a) The graph is not an "Annual-average Temperature"
for b) The graph may be the annual-average for a number of
unspecified c) The multiple renditions of the graph were so blurry, that it causes one to suspect a deliberate effort was made to obscure its contents. d) Given the problems with Alaskan climatic data before 1950, better citation of database sources should have been made. e)
Over sampling of the f) Over the last 100 years, the
temperature of g) During the 20th Century, there were three significant
climatic periods in h) During the 20th Century, over 80% of Alaskan warming occurred before 1940. i) The "Great Pacific Climate Shift" which occurred from 1976 to 1977, is clearly visible on the graph as an increase in temperature of over 2.5°F. j) Most of the Alaskan warming which took place in the last quarter of the 20th Century occurred during the "Great Pacific Climate Shift" and is closely associated with a shift in the Pacific Decadal Oscillation (PDO) which occurred at the same time. k) Since 1978, Alaskan temperatures have been stable. The
caption on the graphic also states that: "Average
temperatures in
The results of linear regression analysis for the annual mean
composite temperature for Fairbanks, Anchorage, Nome and & Barrow indicate
the for the period from 1950 to 1999 the Alaskan temperature has increased by
2.91°F (1.61°C), not the 4°F reported by the
USNA. Given the lack of adequate
accreditation for the " If the Alaskan temperature data is typical of the quality of
the datasets in the "US National Assessment of the Potential Consequences
of Climate Variability and Change Mega-Region: Conclusion The opening
introduction for the 1960's science fiction television show "The Outer Limits"
contains the line: "We can change the
focus to a soft blur, or sharpen it to crystal clarity." Perhaps
this old science fiction show was the source of inspiration for the United States Global Change Research Program
when they wrote the Alaska
section of the "US
National Assessment of the Potential Consequences of Climate Variability and
Change" report, for science fiction is certainly what the report is!
The graphic for the most the most critical element of Alaskan climatology, the
temperature, was reduced to a "soft blur", lest anyone read it and
understand its meaning. To compound this egregious offence to Alaskan
climatology, the USNA alleged that this softly blurred graphic depicted the
"Annual-average Temperature" for 20th Century Into this morass of conflicting numbers, the New York Times wandered, filled with the zeal of all true believers. Searching for signs and portents of the impending climatic apocalypse, they used the minimum and maximum temperature limits of the USNA Alaskan temperature graphic to mean that Alaskan temperature had increase by 7°F over the last thirty years of the 20th Century. It is possible that the New York Times did not view the USNA Alaskan graphic directly but had its contents conveyed to them. One thing is very clear, the graph is the source of the disinformation, because the 7°F temperature increase is dependent on the dates of 1971 and 1993. When the New York Times was challenged as to the correctness of the information they reported, there were two options available to them: (1) they could have reported 4°F temperature increase which was used in the official USNA Alaskan report, or (2) turned to the CGC, which provide the New York Times with their original 5.4°F temperature increase. The New York Times would have had no way of knowing that the second value was just a flawed as the first. The real mystery is why didn't the New York Times use the official USNA value of 4°F for Alaska? I suspect they would have to admit that they had committed a serious error and 4°F over 50 years, is not a dramatic as 7°F over 30 years. Alaskan climatology is a very serious issue and it is unfortunate that the USNA did not treat it with the clarity it deserves. . Large sums of money and a significant amount of human effort have gone into the creation of a report whose primary objective is the advancement of a political agenda and not science. Hopefully this omission will be corrected in the future. References 1.
" 2. " 3. "United States Environmental Protection Agency", (http://www.epa.gov/). 4. "The FANB temperature record", by Dr. Sue Ann Bowling (http://climate.gi.alaska.edu/Bowling/FANB.html). 5. "The 6. "In response to the
New York Times Article of 16 June 2002 and Op/Ed of 24 June 2002" by Brian Hartmann &
Dr 7. "New York Times
Correction", 8. "Center for Global Change and Arctic System Research", (http://www.cgc.uaf.edu/). 9. "Organization of Center for Global Change and Arctic System Research", (http://www.cgc.uaf.edu/organization.html). 10. "GLOBAL WARMING DEBATE INVOLVES . .
. Dueling digits", 11. " 12. " 13. " 14. "Goddard Institute for Space Studies, Surface Temperature: Station Data", (http://www.giss.nasa.gov/data/update/gistemp/station_data/). 15. "The Potential Consequences of Climate Variability and Change" by Gunter Weller, Patricia Anderson & Bronwen Wang, December 1999 (http://www.besis.uaf.edu/regional-report/regional-report.html). 15.1. "Preface and Executive Summary" (http://www.besis.uaf.edu/regional-report/Preface-Ex-Sum.pdf), page 5. 15.2. "Cross-Cutting Issues and Challenges of Future Climate Change" (http://www.besis.uaf.edu/regional-report/Issues1.pdf). 16. " 17. "Alaska Regional Assessment Group", (http://www.usgcrp.gov/usgcrp/nacc/alaska.htm). 18. "US National Assessment of the Potential Consequences of Climate Variability and Change", 2000 (http://www.usgcrp.gov/usgcrp/nacc/default.htm). 19. "US National Assessment of the Potential
Consequences of Climate Variability and Change Mega-Region: 19.1. "Climate Change
Impacts on the 19.2. "Climate Change
Impacts on the 19.3. "Potential
Consequences Of Climate Variability And Change For 19.4. "Potential
Consequences Of Climate Variability And Change For 20. " 20.1. URL: http://www.usgcrp.gov/usgcrp/Library/nationalassessment/images/AKObserved-b.jpg, referenced by [19.1], very small poor quality color image. 20.2. 20.3. URL: http://www.usgcrp.gov/usgcrp/Library/nationalassessment/11AK.pdf, page 1, referenced by [19.2], medium size color image of low quality. 20.4. URL: http://www.usgcrp.gov/usgcrp/Library/nationalassessment/10Alaska.pdf, page 5, referenced by [19.3], extremely poor quality black and white image. 20.5. URL: http://www.usgcrp.gov/usgcrp/Library/nationalassessment/10C.pdf, page 1, referenced by [19.4], best quality color image in set but still of low quality. 21. "Climate Change Science: An
Analysis of Some Key Questions" by 22. |