|
Weather Singularities over Alaska? A Case Study in Climate Research by Jan Curtis (Alaska Climate Research Center,
Just as the scalpel is an essential instrument for the surgeon, statistics is the tool of choice for the climatologist. Sorting through years of hourly and daily weather data in the search for a trend or recognizable pattern is a daunting task. The importance for finding order out of all this apparent chaos will in part help answer critical questions about our survival as a species. For example, are the much-debated claims of global warming really based on scientific facts, and if so, what is its cause? By
the way, just what is global warming anyway? The earth has been warming and
cooling long before man first appeared on the scene. So why is it an issue today? As many people are starting to
realize, statistics cannot be used to prove or disprove anything but
only to show a correlation and not causality. This distinction is important
and often confuses more than clarifies.
Facts are claimed as truth when they may only be possibilities. However, when used correctly,
statistics can, at the very least, give researchers clues for which
direction to head towards for the best answers and solutions. When using a climate record from any weather station,
homogeneity of data is rarely found.
Over the years, data becomes less uniform because of the use of
different weather sensors, infrequent calibration of aging equipment,
different weather observer experience, changing observer techniques and
reporting procedures, and slight changes to a station's location or its
immediate surroundings. These
factors all can have serious implications on data reliability. Additionally, there's always the
possibility for human error when transcribing the data and sometimes the
equipment is malfunctioning without being noticed. Attempts to fill in these
inaccuracies and gaps, especially over the long term, are difficult. So depending on what assumptions are made to normalize the
weather record will very much determine its final quality and usability. Fortunately, the science of
meteorology overall is improving. Weather forecasting has come a long way since the era of
satellite remote sensing and the use of dense surface weather station
networks. With the introduction of the Next Generation Radar (NEXRAD),
Automated Surface Observing System (ASOS), and weather satellite
atmospheric sounders, data availability and quality are improving. We are beginning to understand
the relationship with various atmospheric indices, such as El Niño
Southern Oscillation (ENSO), perhaps being the most famous one. While these events are more or
less predictable several years in advance, and we know in general what
type of seasonal weather will occur, the ultimate cause for these
regional and global weather pattern shifts are still not fully
understood. There are however, weather events that are predictable
almost to the hour (diurnal variation) or to the day
(annual cycle) with
remarkable regularity. Known
in the scientific literature as "weather singularity" (Huschke 1959), these events have a known physical explanation. On a local scale, the land-sea
breeze or mountain-valley breeze will occur when the temperature
difference between two adjacent but dissimilar topographical or
geographical areas reaches a known threshold that induces a localized
circulation. In the
tropics, rainfall follows the diurnal surface pressure cycle with
showers occurring around 4AM and 4PM.
On the regional scale, the monsoons over India or over the
southwest US occur when the summer land heats faster than the nearby
ocean, thus inducing rising air that condenses over land. This effect is enhanced when
moist air from the ocean is forced inland and up against mountain
ranges. While these events
occasionally fail to materialize on fixed schedule, over the long term,
they appear with a very high degree of repeatability thus making their
forecast very reliable. Another singularity, such as the famous "January Thaw" over New England (C.M. Godfrey, et al. 2001) is probably nothing more than the general public's first awareness that winter's cold grip has finally let up. It's the rare or unusual departure from normal (average) that gets remembered while the common or mundane is taken for granted. If the weather record is long enough, exceptional weather events are averaged out and the resulting data is uniform with no abrupt changes from day to day. This principle works assuming the climate doesn't change over the centuries. Of course, paleoclimatology, the study of ancient climates, shows that the climate is always changing, and sometimes quite rapidly over a period of just a few decades.
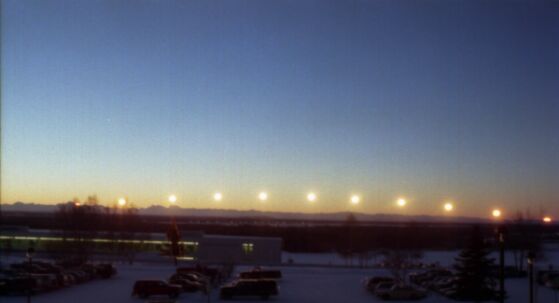
A similar phenomenon as the January thaw may occur over a
large part of Alaska (Figure 1). Looking
at the daily average temperatures over Interior Alaska (Figure 2), a
couple of remarkable reversals in temperature occur during the coldest time of year. What makes these departures
interesting is that they occur at a time when the sun is unable to heat
the atmosphere due to its very low altitude and very short time above
the horizon (as depicted above). Looking at the daily running average temperatures for a
number of stations around the state shows very similar tendencies. These long-term records help to
verify that the data from Fairbanks (the city used to test our hypothesis)
is consistent with other surrounding stations. Most continental locations over North America experience the warmest and coldest average daily temperatures about three weeks after the solstices. This is verified nicely for most sub-Arctic, inland Alaska stations. Fairbanks' daily temperatures (Figure 3) show that during the past 84 years, unexpected departures from daily averages occur, especially in the coldest months when standard deviations in temperature are the largest.
A closer look at Fairbanks' winter temperatures (Figure 4) illustrates several possible singularities. A temporary maximum (#1) around 21 November a secondary maximum (#2) around the first day of winter, and a third maximum (#3) a month later. It is interesting to note that by using the normals (30-year averages) since 1931, most of these large departures from average (#1- #3) are consistent and occur within a day or two of each other although their magnitudes differ. So, what are the physical causes for these unexpected departures from average?
Looking at the November 21 max (#1), it was initially
thought that remnants of late season typhoons were advecting lots of
warm moist southerly air from the tropics into Alaska. While this does occasionally
happen, the timing of such events to a particular day does not. At high latitudes in winter, the amount of cloud cover is the main factor for regulating surface temperatures. Simply stated, the more clouds, the warmer it is. Clouds trap and radiate long-wave radiation back to the surface. Clear nights in Interior Alaska are usually 30°F to 40°F colder than cloudy ones. Figure 5 shows the average cloud cover over Fairbanks from 1948-1997. Note that the daily average is fairly constant but does dip around 13 January and agrees with the absolute minimum in Figure 4, the coldest average day of the year. Although this correlates well and would be expected, the actual cause for this sudden decrease in clouds is unknown. The other proposed singularities don't appear related to cloud cover over the long-term.
So if there isn't a physical explanation for these singularities, statistics might be able to answer this mystery. In the table below, the number of years that the average temperature for each singularity exceeds a certain standard deviation is examined. In a sample of 84 to 85 years, we would expect a certain number of events with specific return periods of say, 20, 60, and 100 years. If there were an actual larger number of rare events, larger SD events would be observed and the daily averages would probably be skewed with an obvious bias (the singularities). To test this, all the singularities were counted. The 13 November date was chosen since its average most closely resembled the best-fit curve for a given day. The results in Table 1 show that there are an unusual number of occurrences of warmer than expected days, especially at the 2.5 SD level than on an average day such as 13 November. The singularities appear to be greatly influenced by a coincidence of large positive temperature departures on those specific dates. Because of the general warming trend over the past century, temperatures do not follow a normal or bell shape distribution curve with equal number of warmer and cooler days from average. Climate research in the Arctic and sub-Arctic shows that extremely rare weather events have a long lasting effect on the average and these singularities might be reflecting this.
So the question remains, are these singularities real? For a singularity to exist, a physical mechanism is needed. One can speculate that as the sun's heating ability over the polar region disappears in winter, cold dense air accumulates. When a critical mass of air is reached, a surge of cold moves southward and is distributed over the middle latitudes in the form of strong high and low-pressure centers (enhanced meridional north-south flow in the upper levels of the atmosphere). With the release of this pool of cold air over the Arctic, a temporary temperature rebound occurs. After about a month, this scenario is repeated and a month later repeated again (Figure 6).
In conclusion, only after several more decades will we better determine if these temperature singularities in Alaska are real or a statistical aberration. References Godfrey,
C.M., D.S. Wilks, and D.M. Schultz, submitted: Is the January Thaw a
Statistical Phantom? Bulletin of the Amer. Meteor. Soc. Huschke, R.E., 1959: Glossary of Meteorology. Amer. Meteor. Soc., 638 pp. Jan
Curtis is the state climatologist for Wyoming. This
research was conducted when he worked for the Alaska Climate Research
Center in 1995-2001.
|