![]()
URBAN
INFLUENCES
ON
SOUTH AFRICAN TEMPERATURE TRENDS
WARWICK S. HUGHES
Tasman Institute, 457 Elizabeth Street, Melbourne, Victoria 3000 Australia
and
ROBERT C. BALLING, JR.
Office of Climatology, Arizona State University, Tempe, Arizona 85287 USA
![]()
ABSTRACT
Temperature trends are examined for a variety
of locations in South Africa. The long-term mean annual temperature record
(1885-1993) shows warming over the past century, with much of the warming
occurring in the most recent three decades. However, our analyses show
that half or more of this recent warming may be related to urban growth,
and not to any widespread regional temperature increase. Maximum and minimum
temperatures for the period 1960-1990 reveal a statistically significant
decrease in the diurnal temperature range in large urban areas, but no
change in the non-urban network. This assessment of the urban effects on
temperature trends in South Africa may contribute to our understanding
of apparent climate changes occurring in the Southern Hemisphere during
the period of historical records.
KEY WORDS: South Africa, Temperature Trends, Urban Effects
INTRODUCTION
Interest in identifying a temperature
response to the known buildup of anthropogenic greenhouse gases has stimulated
research on historical climate records from around the world. Most of this
research has focused on the mid-latitudes of the Northern Hemisphere where
most high-quality, long-term temperature records can be found. Over the
past century, these Northern Hemispheric locations generally have warmed
by approximately 0.5°C with much of the warming occurring in the low-sun
seasons and at night (Folland et al., 1990, 1992). Many studies have been
conducted showing that urban growth has played a role in producing these
patterns found in the historical climate records (see Jones et al., 1990;
Balling, 1992).
When compared to the Northern Hemispheric land areas, climate records are
relatively sparse throughout much of Southern Hemisphere. One notable exception
is the availability of climate records for stations in South Africa where
some larger cities have mean temperature data extending more than a century
and many smaller towns have digitized maximum and minimum temperature records
available from 1960 onward. The purpose of this paper is to examine these
records to determine (a) trends in mean temperature in South Africa over
the past century, (b) trends in the mean, maximum, and minimum temperatures
over the past 30 years, and (c) the potential role of urbanization in generating
temperature trends in the South African records. The results of our investigation
should add to the growing body of knowledge on climate changes that have
occurred in the Southern Hemisphere over the past century.
The following temperature databases are
used in this investigation:
1) Jones (1994) has generated a new time series of historical temperature
data that are available for 5° latitude by 5° longitude grid cells
throughout the world. Four of these cells comprise most of South Africa
and have records extending from the 1880s to the near present. Jones (1994)
used 15 stations from South Africa in constructing these time series including
the data from the relatively large cities of Pretoria, Johannesburg, Kimberly,
Durban, Cape Town, and Port Elizabeth.
2) Maximum and minimum temperature data were kindly supplied to us by the
Weather Bureau of the Republic of South Africa for the period 1960-1990.
These records include data from five very large metropolitan areas and
19 stations from non-urban locations (Figure 1; Table I). These 19 stations
have three-letter locational codes (du Toit, 1988) indicating agriculture,
irrigation, lighthouse, or prison locations. The small percentage of missing
months in these data (1.9%) have been replaced by interpolation from adjoining
months; there are 1.0% missing data from the five large metropolitan areas
over this same time period.
3) For comparative purposes, we examine the 12-station South African diurnal temperature range data of Karl et al. (1993) over this 1960-1990 period. In commenting on the potential influence of urban growth on these data, Karl et al. (1993, p. 1014) state that the data from "South Africa include some stations from urban areas, but countrywide decreases of the DTR are not overwhelmed by these stations."
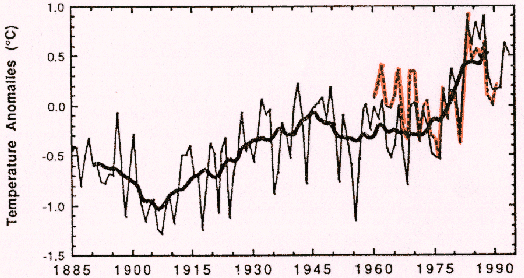
A plot of the new Jones (1994) annual temperature data from four grid cells in South Africa reveals a cooling from 1885 to 1915, a warming from 1915 to 1945, a slight cooling from 1945 to 1970, and rapid warming from 1970 onward (Figure 2). The temperature anomalies show a very warm period extending from 1983 to 1987 when the values averaged +0.77°C above the mean for the 1961-1990 base period. Over the entire 109-year period of record, South African mean temperature appears to have increased linearly by 1.13°C; these data have a first-order autocorrelation of +0.71. Although South Africa covers only 0.24 percent of the earth's surface, this statistically significant warming in an area of the Southern Hemisphere with long-term records is broadly consistent with the expected warming given the buildup of greenhouse gases. However, the question remains whether this warming is widespread throughout South Africa or simply an artifact of urban growth. This question becomes even more interesting when considering that Mühlenbruch-Tegen (1992) analyzed temperature data from 18 urban and non-urban stations in South Africa over the period 1940 to 1989 and found little evidence for changes in mean temperatures.
To address the issue of possible urban contamination
in the South African temperature time series, we examine the 1960-1990
temperature data from both the five large metropolitan stations and the
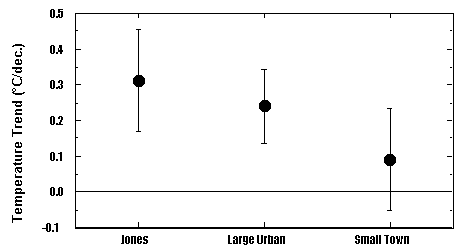
19 non-urban stations. We find that over this 1960-1990 period, the Jones
(1994) temperature data warmed at a rate of +0.31°C decade-1 or +0.90°C
overall (Figure 3). Obviously, a substantial part of the warming of the
past century in the Jones (1994) South Africa temperature record has occurred
in this recent period. The warming in the five large cities averaged 0.24°C
decade-1, and the trend in the difference between the two temperature time
series is statistically significant. Even when we gridded the data from
the large cities to more evenly represent South Africa, we continued to
find that the Jones (1994) data warmed faster than the warming established
for the largest cities in South Africa. It is possible that temperature
data from surrounding countries incorporated into the Jones (1994) calculations
may be responsible for this difference.
To further explore the nature of temperature
variations in the South African data, we focussed our attention on the
mean temperatures from the 19 non-urban stations. We began our analyses
by examining each time series for homogeneity using the von Neumann ratio
as a test of randomness against unspecified alternatives (Mitchell et al.,
1966). Using groups or pairs of near-neighbor stations, we developed composite
times series of mean annual temperatures. We subtracted the data from each
station in the cluster from the group mean, and we tested the time series
of temperature differences for randomness. A high level of homogeneity
should produce a random pattern in the differences while station inhomogeneities
should generate non-random signals in the time series of differences. Sixteen
stations passed this test, but Port Shepstone, Wepener, and Warmbad-Towoomba
appeared to have some type of inhomogeneity with respect to surrounding
stations. Accordingly, we conducted our analysis with and without these
stations contributing to composite, country-wide temperature time series.
The warming rate for the 19 non-urban centers
was a statistically insignificant 0.09° decade-1 over the 1960-1990
period; including or deleting the three stations with potential homogeneity
problems had no significant effect on this result. The correlation between
the Jones data and the 19-station non-urban temperatures is +0.84, and
the anomalous warm period from 1983-1987 appears in both records (Figure
2). However, the disparate trends in temperature (+0.09° decade-1 verses
+0.31°C decade-1) suggest that urbanization has influenced the Jones
(1994) records for South Africa over the 1960-1990 period of apparent rapid
warming.
We recognized that our network of non-urban
stations is concentrated in the eastern half of South Africa. Therefore,
we interpolated the temperature data to a 2.5° latitude by 2.5°
longitude grid established for the country. The interpolation procedure
allowed the westernmost station, Port Nolloth, to more strongly impact
the composite temperature time series. Despite the fact that Port Nolloth
had a relatively large rate of warming (+0.30° decade-1), the gridding
procedure did not change any of the fundamental results; the gridded temperature
data showed a warming of 0.11°C decade-1.
DIURNAL TEMPERATURE RANGE
Scientists have found a decrease in the diurnal temperature range in many parts of the world, although a few exceptions have been found where the range has actually increased (see Karl et al., 1993). Mühlenbruch-Tegen (1992) found that during the period 1940-1989, South African maximum temperatures had decreased generally while minimum temperatures had increased; this pattern was most pronounced during the spring season, but was reversed in the autumn period. In their comprehensive survey of diurnal temperature range patterns, Karl et al. (1993) found a slight increase in maximum temperatures, a significant increase in minimum temperatures, and a corresponding decrease in the diurnal temperature range in South Africa for the period 1951-1991. We have re-analyzed these data for the large cities and small towns and found the following for the 1960-1990 period:
1) Maximum temperatures increased about the
same across South Africa regardless of the size or location of the station.
The rate of increase in maximum temperatures was +0.11°C decade-1 at
the small towns and +0.12°C decade-1 at the largest city locations.
These increases were not statistically significant.
2) Minimum temperatures showed a pronounced
urban influence. At the non-urban stations, minimum temperatures increased
at a statistically insignificant rate of +0.07°C decade-1; gridding
the station data or eliminating the three stations with potential homogeneity
problems did not alter this result. However, minimum temperatures increased
at +0.34°C decade-1 at the five large towns, and the trend is statistically
significant.
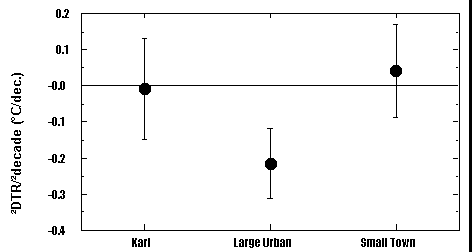
3) The trend in selected diurnal temperature
range time series for the period 1960-1990 is presented in Figure 4. The
data from the five large towns show a clear decrease in the diurnal temperature
range, while the remaining two datasets show no statistically significant
trends.
Our results have shown that South Africa has warmed over the past century, and according to the new Jones (1994) temperature data, South Africa may have warmed by over 1°C. However, we have found that much of this warming occurred over the most recent three decades, and during this period, urban growth appears to have contaminated the records. In contrast to data from urban areas, we find that the 19 non-urban sites in South Africa have not warmed significantly during this recent period. The lack of overall warming in the country is consistent with the results presented by Mühlenbruch-Tegen (1992). The diurnal temperature range was decreasing in the urban settings, but not at the rural locations.
The analysis of historical records from the
Southern Hemisphere are particularly important with respect to the greenhouse
issue. Due to the sparsity of records for this half of the planet and due
to the generally low levels of aerosol sulfates which can counteract greenhouse
warming (Jones et al., 1994; Taylor and Penner, 1994), the areas with long-term
climate data in the Southern Hemisphere should receive special attention.
In this regard, we hope that our assessment of urban contamination of South
African records contributes to our understanding of climate changes during
the time of historical climate records. Our analyses show that the warming
apparent in the new Jones (1994) data probably is inflated by urban effects;
in addition, we could not find any decrease in diurnal temperature range
in the rural temperature data.
Balling, R.C., Jr. 1992. 'The urban heat island: Contaminant to the global temperature record?' in Majumdar, S. K., Kalkstein, L.S., Yarnal, B.M., Miller, E.W., and Rosenfeld, L.M. (eds), Global Climate Change: Implications, Challenges and Mitigation Measures, Pennsylvania Academy of Science, Easton, Pennsylvania, 179.
du Toit, P.S. 1988. Climate of South Africa (Climate Statistics up to 1984), WB40, Weather Bureau, Department of Environmental Affairs, Govt. Printer, Pretoria, 1st Edition.
Folland, C.K., Karl, T.R., Nicholls, N., Nyenzi, B.S., Parker, D.E., and Vinnikov, K.Y. 1992. 'Observed Climate Variability and Change', in Houghton, J. T., Callander, B.A., and Varney, S.K. (eds), Climate Change 1992: The Supplementary Report to the IPCC Scientific Assessment, Cambridge University Press, Cambridge, 135.
Folland, C.K., Karl, T.R., and Vinnikov, K.Y. 1990. 'Observed climate variations and change,' in Houghton, J. T., Jenkins, G.J., and Ephraums, J.J. (eds), Climate Change: The IPCC Scientific Assessment, Cambridge University Press, Cambridge, 195.
Jones, A., Roberts, D.L., and Slingo, A. 1994. 'A climate model study of indirect radiative forcing by anthropogenic sulphate aerosols', Nature, 370, 450.
Jones, P.D. 1994. 'Hemispheric surface air temperature variations: A reanalysis and an update to 1993', J. Climate, 7, 1794.
Jones, P.D., Groisman, P.Y., Coughlan, M., Plummer, N., Wang, W.-C., and Karl, T.R. 1990. 'Assessment of urbanization effects in time series of surface air temperatures over land', Nature, 347, 169.
Karl, T.R., Jones, P.D., Knight, R.W., Kukla, G., Plummer, N., Razuvayev, V., Gallo, K.P., Lindseay, J., Charlson, R.J., and Peterson, T.C. 1993. 'Asymmetric trends of daily maximum and minimum temperature', Bull. Amer. Meteorol. Soc., 74, 1007.
Mitchell, J.M., Jr., Dzerdzeevskii, B., Flohn, H., Hofmeyr, W.L., Lamb, H.H., Rao, K.N., and Wallen, C.C. 1966. Climatic Change. Technical Note 79, World Meteorological Organization, Geneva, 79 pp.
Mühlenbruch-Tegen, A. 1992. 'Long-term surface temperature variations in South Africa', S. Afr. J. Sci., 88, 197.
Taylor, K.E., and Penner, J.E. 1994. 'Response of the climate system to atmospheric aerosols and greenhouse gases', Nature, 369, 734.
Table I. Description of South African stations
|
Station |
Latitude |
Longitude |
Elevation |
ÆT |
|
Non-Urban Sites: |
||||
| Cape St. Francis |
34-12 |
24-50 |
7 |
.073 |
| Bathurst |
33-31 |
26-49 |
259 |
.091 |
| Great Fish Point |
33-32 |
27-06 |
73 |
.020 |
| Grootfontein II |
31-29 |
25-02 |
1270 |
.018 |
| Port Shepstone |
30-44 |
30-27 |
17 |
.155 |
| Wepener |
29-44 |
27-02 |
1438 |
.142 |
| Cedara |
29-32 |
30-17 |
1076 |
.142 |
| Port Nolloth |
29-14 |
16-52 |
4 |
.299 |
| Glen College |
28-57 |
26-20 |
1304 |
.053 |
| Koopmansfontein II |
28-12 |
24-04 |
1341 |
.023 |
| Cape St. Lucia |
28-30 |
32-24 |
107 |
.195 |
| Armoedsvlakte |
26-57 |
24-38 |
1234 |
.050 |
| Nooitgedacht |
26-31 |
29-58 |
1694 |
.148 |
| Rustenburg |
25-43 |
27-18 |
1157 |
.325 |
| Buffelspoort II |
25-45 |
27-29 |
1230 |
-.106 |
| Marico |
25-30 |
26-21 |
1078 |
.081 |
|
Warmbad-Towoomba |
24-54 |
28-20 |
1143 |
-.071 |
| Mara |
23-09 |
29-34 |
894 |
.016 |
| Macuville |
22-16 |
29-54 |
522 |
.074 |
|
Large Cities: |
||||
| Vereeniging |
26-28 |
28-00 |
1704 |
.234 |
| East London |
33-02 |
27-50 |
125 |
.082 |
| Port Elizabeth |
33-59 |
25-36 |
60 |
.291 |
| Durban |
29-58 |
30-57 |
8 |
.346 |
| Johannesburg |
26-12 |
28-06 |
1753 |
.240 |

Figure 1. Map of South Africa showing Jones grid cells, five large cities, and 19 non-urban stations

Figure 2. Jones (1994) South African temperature anomalies 1885-1993, with 10-year smoothed values. The orange over black dashed line indicates 1960-1990 temperature anomalies of the 19 non-urban sites.

Figure 3. Plot of 1960-1990 mean temperature trends for various South African datasets along with 0.95 confidence levels

Figure 4. Trends in various South African diurnal temperature range datasets for the period 1960-1990
![]()
Back to "Still Waiting For Greenhouse"