Canadian Arctic
 Eureka,
Baffin Island, in the Canadian Arctic, data to 1995. Eureka,
Baffin Island, in the Canadian Arctic, data to 1995.
Frobisher Bay,
Baffin Island, in the Canadian Arctic, Data to 1999
Inuvik,
Northwest Territory of Canada. Between 1958 and now Inuvik has gone from
a
little Inuit fishing village to a significant
petroleum base, possibly affecting its record. Data to 1995
Mould
Bay, Melville Island, in the Canadian Arctic, data to 1992
 Inukjuak,
Coral Harbour & Fort Chimo. Northern Canada. Map & model.
Winter temperatures. Data to 2000
Inukjuak,
Coral Harbour & Fort Chimo. Northern Canada. Map & model.
Winter temperatures. Data to 2000
Coral Harbour, Frobisher Bay, Clyde, &
Hall Beach, northern Canada. Data to 2000
Resolute,
Devon Island, in the Canadian Arctic, data to 1995.
Sachs
Harbor, Banks Island, in the Canadian Arctic, data to 1985
Whitehorse, Yukon, Canada. Also Seasonal temperatures and map. Data to 2002
Alaska
Bethel,
in southwestern Alaska, data to 2002
Cold
Bay, Alaska Peninsula, Alaska, USA. Data
to 1999
Coral
Harbour, Alaska, USA, Data to 1999
Cordova,
Alaska on the south coast. Chart from Alaska Climate Research Center. Data
to 1995
Fairbanks, Alaska. Case study in urbanisation - Raw data for city and university - data differences between them -
Fairbanks adjusted
by NASA-GISS for urbanisation. Data to 2000
Fairbanks & Fort Greely, Alaska, USA.
Fort Greely is 137 km ESE of Fairbanks.
Data to 1999
Gulkana & Fort Greely, Alaska.
Gulkana is in southern Alaska, 150 miles east-northeast of Anchorage. Data to 1999
Point
Barrow, Alaska, showing seasonal and annual temperatures. Data to
2001
Also see winter and
summer temperatures separately
Juneau
& Kodiak, Alaska. These stations on opposite sides of the Gulf of
Alaska validate each other. Data to 1999
Kotzebue,
Alaska, adjacent to the Bering Strait. Data
to 1999
Nome,
Alaska, also adjacent to the Bering Strait. Data
to 2001
Northway,
Alaska. Located in the interior. Chart from Alaska Climate Research Center.
Data to 1994
St
Paul Island, Bering Sea, Alaska, USA. This station is far out to sea
from Alaska. Data to 1999
Talkeetna,
Alaska, 200 km north of Anchorage. Data
to 1999
Yakutat,
Alaska on the south coast. Chart from Alaska Climate Research Center.
Data to 1995
Greenland, Iceland, northern Norway,
and the Arctic Ocean
Akureyri & Reykjavik, Iceland. Akureyri is a remote station
on the north coast of Iceland facing the Arctic Ocean.
Reykjavik is the capital city of Iceland, pop.
100,000. Data to 2003
Angmagssalik
on the east coast of Greenland, is an area tipped to warm +10 degs. Data
to 2003
The `Arctic Rim' - four stations, Ostrov Vize, Danmarkshavn, Svalbard and Franz
Josef Land. Data to 2000
Bear
Island, in the Arctic Ocean directly north of Norway, just inside the
+18 deg. contour. Data to 1999
Bodo,
Norway, is located on the far north coast of Norway, just inside the Arctic
Circle.
Data to 2003
Danmarkshavn,
Greenland, seasonal & annual temperature. Plus summer
months temperatures. Data to 2002
Egdesminde,
Greenland. Data to 1999
Franz
Josef Land, Arctic Ocean. This station is only 10° latitude from
the North Pole. Data to 1999
The `GIUK Gap'. Six stations to represent the ocean gap
between Greenland, Iceland, and UK. Data to 2000
Godthaab
on the west coast of Greenland, bears a strong similarity to the trend
at Angmagssalik. Data to 2003
Godthaab
& Angmagssalik, Greenland, summer temperatures, the season for
ice melt. Data to 2003
Ilulissat, Greenland (Jakobshavn
& Egedesminde). Data to 2002
Jan
Mayen Island in the Greenland Sea north of Iceland. Data
to 2003
Keflavik
& Hofn, Iceland. Keflavik is a US Air Force base. Hofn is adjacent
to the Vatnajokull Ice Cap. Data to 1999
North Greenland stations. Thule, Dundas &
Danmarkshavn. Data to 2001
Spitzbergen,
Arctic Ocean. Old data, but it shows the 1960s Arctic cooling very well.
Data to 1975
NY-Alesund. Also on Spitzbergen.
Sea level data to 2001
Stykkisholmur,
a small community on the west coast of Iceland, 100 km north of Reykjavik. Data to 1998
(thanks to Agust
Bjarnason for the data). Also Stykkisholmur & Teigarhorn, Iceland. Data to 1999
Thorshavn,
Faeroe Islands, North Atlantic Ocean. Halfway between Scotland and Iceland. Data to 1999
Thule, Dundas Radio & Danmarkshavn,
in Northern Greenland. Data to 2001
Tromo/Skatto,
Norway. Data to 2003
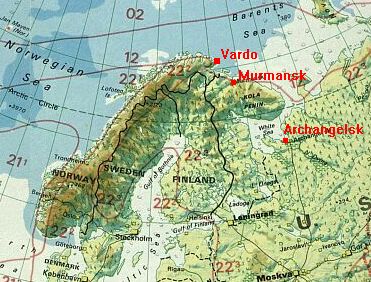
Vardo,
Norway. Lies on the northern Arctic coast of Norway close to the Russian
border.
A valuable continuous long-term record from 1840. Data to 2003
Russia
Ajan,
eastern Siberia, Russia. This station is on the Russian coast of the Sea
of Okhotsk. Data to 1999
Dzardzan & Olenek,
Siberia, Russia. These stations lie in the Siberian interior near the Lena
River. Data to 1999
Kanin
Nos, Ostrov Vize, & Ostrov Dikson, Russia. On the Arctic coast of Russia. Map. Data to 1999
Kirensk & Tura, Russia. Rural stations
located north of Lake Baikal in central Siberia. Data to
2000
Korf,
eastern Siberia, Russia. This station is on the eastern coast of the Kamchatka
Peninsula. Data to 1999
Murmansk, Archangelsk (Russia)
& Vardo (Norway for comparison). Map. Data to 2001
Nikolayevsk & Oktiabrskaya, Russia
(Far East). Two stations on opposite sides of the Sea of Okhotsk. Map. Data to 2001
Okhotsk,
eastern Siberia, Russia. This station is also on the Russian coast of the
Sea of Okhotsk. Data to 1999
Ostrov
Dikson, Siberia, Russia. This station lies east of the Urals on the
Russian Arctic coast. Data to 1999 .
Ostrov
Kotel, Russia. An island in the Arctic Ocean off the northeast Siberian
coast. Data to 1999
Ostrov
Vize, Siberia, Russia. This station is an island off the north coast
of Siberia, northeast of
Novaya Zemlya, deep within the Arctic Ocean. Data to 1999 .
Salehard,
Siberia, Russia. This station is located in the Russian Arctic and is one
which got CRU very excited.
From the graph, it is difficult to see why.
Data to 1995
Sejmchan,
eastern Siberia, Russia. located inland within the far east territories. Data to 1999
Turuhansk,
Siberia, Russia. This station is also located in the Russian Arctic and
also caused inexplicable
excitement at CRU. Data
to 1999
Europe
Scandinavia
Haparanda,
Sweden. This station is on the Swedish coast of the Gulf of Bothnia next
to the Finnish border. Data
to 2003
Jyvaskyla, Finland & Ostersund, Sweden.
A pair of stations in the centre of these countries. Data
to 2000
Kajaani,
Finland, is in central Finland close to the Russian border. Also includes
data for Reboly, Russia
which is only 150 km away across the border.
The two are in lockstep and thus mutally validating. Data
to 1999 .
Sodankyla,
Finland. Also in the far northern interior of Finland. Data
to 2003
Visby Flygpla, Sweden.
This station is on an island 110 miles south of Stockholm. Map. Data to 2000
Eastern Europe
Debrecen & Pecs, Hungary. Data
going back to 1853. Data to 2000.
Wlodawa & Bialystok, eastern
Poland, 100 miles northeast and southeast of Warsaw. Data to 2001.
Western Europe
Central
England, This is a regional series first developed by the late Prof
Gordon Manley and now maintained and
updated by the Hadley Centre, and is one of
the most heavily urbanised areas in the world. Night
light map of the UK
to show population density. Data
to 1998.
Central England Temperature 1659-2002
full data. Central England Temperature
1770-2000 selective version.
The industry prefers the 1770 start date as it then
omits a very warm period around 1730.
De Bilt, Netherlands. A valuable 300-year-old
record in a small urban area. 20th Century chart Data to 2000
Gibraltar,
southern tip of Spain. An erratic record suggests frequent site and/or
instrument changes. Data to 1995
Horta,The
Azores, lies far out into the North Atlantic Ocean west of Portugal, a
good litmus site for
North Atlantic ocean temperature. Data to
1995
Lerwick
is on the Shetland Islands, in the Norwegian Sea to the north of Scotland.
Data to 1995
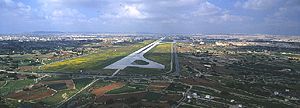
Luqa International Airport, Malta. Photo of the airport. Data to 2002
Malin
Head, on the northern tip of Ireland, - a good paired comparison with
Valentia (above). Data to 1995
Manchester Airport.
Adjusted & unadjusted records. Demonstrates
inadequacy of heat island adjustment. Data to 2001
Navacerrada & Madrid, Spain, 1941-2001. A broken
record, but shows Madrid urban warming. Data to 2001
Plymouth,
southwest England. Large urban centre. Data to 1995
Thorshavn,
Faeroe Islands, roughly half-way between Scotland and Iceland. Data to
1995
Tiree,
Inner Hebrides Islands, Scotland, UK. Data
to 1999
Valentia Observatory & Shannon Airport, Ireland. A
second chart comparing Valentia, Shannon and Roche's Point.
Valentia lies on the southwest tip of Ireland, directly
facing the North Atlantic Ocean and is the first point of contact
in Europe
for the Gulf Stream. This is a particularly valuable record as it is a clean rural record running from 1869 to
1999
and has been under scientific supervision, in a very strategic climatic
location. Shannon Airport and Roche's
Point are used for comparison and shows a developing heat
island at Shannon. Map of the area. Data
to 2001
Asia (excl. Russia)
Afyon & Konya, Turkey. Rural stations in
western Turkey. Map. Data to 2000
Ankara,
Turkey. This graph also shows the urban `adjustment' applied by GISS. Data
to 1999
Bahrain &
Dharan (seasonal). Plus Annual.
Dhahran is in Saudi Arabia, Bahrain is an offshore island (map).
Data to 2001. For a
detailed report on these stations and guest commentaries,
click here
Bikaner & Jodhpur, India. This station
pair is in western India, both with a century+ record. Data
to 1999
Cardzou, Turkmenistan. This
station is in the eastern part of Turkmenistan. Data to
1998
Choshi,
Japan. This station is located on the east coast of Japan, facing the Pacific
Ocean, and is affected
by the Kuro Siwo ocean current which passes
near there. Data to 1995
Edirne & Canakkle, north-western
Turkey. Map. Data to 2000
Gauhati & Darbhanga, India.
Gauhati is in the Bramahputra River Basin, close to the Bhutan border. Darbhanga
is in
the Ganges Valley Basin, close to the Nepal border.
Data to 1999
Krasnovodsk,
Turkmenistan. This station is on the eastern coast of the Caspian Sea. Data to 1998
Ma'An & Irwaishe, Jordan. A rural pair. Data to 1999
Macao & Guangzhou, China. This compares the
Portuguese record from Macao with the Chinese record
from the former Canton. Data to 2001
Nanning, southern China. Annual and
seasonal mean temperature. The region where SARS began. Data to 2003
New
Delhi, India. This is a city of 8 million people. In spite
of being heavily urban, it shows no sign of warming.
Data
to 2001
Osaka & Maizuru,
Japan. Contrasts a big city to a small town north of Osaka. Data to 2001
Palmyra and Hama, Syria, on same graph for
comparison. Data to 1999
Peshawar & Fort Sandeman,
Pakistan. Close to the Afghan border. Data to 2000
Singapore.
An over-heated city, so it doesn't really belong here, but here it is anyway.
Data to 1995
Srinagar, Kashmir, (India part), A high
altitude station near the Himalayas. Data to 1999
Tabuk, Saudi Arabia.
Located inland in north-western Saudi Arabia. Data
to 2000
North America (excl. Arctic)
Canada
Inukjuak, Coral Harbour, Fort
Chimo, Northeast Canada (warming map/model).
Winter temperatures to compare against
winter warming predictions shown on the map. Data to 2000
Gander
International Airport, Newfoundland, Canada. Data
to 1999
Goose,
Newfoundland, Canada. Data to 1999
London, Ontario & Erie, PA. Matched
pair. London is David Suzuki's hometown, and he claims winters there are
now arriving later than when he was a boy growing up there. See this discussion of the issue. Also see
temperature
histories for both stations for November and
December only, the very months at issue in his claims. Data
to 2001.
Sable
Island, Canada, located 200 km off the coast of Nova Scotia in the
North Atlantic Ocean, and sits astride
the Gulf Stream. It is thus a key litmus
station to detect any warming. Data to 1999
U.S.A. - Northeast
Concord, New Hampshire. Data
to 2002
Farmington,
Maine, USA. Located about 100 km west of Bangor, Maine. A cooling overall. Data to 1998
Gloversville & Stillwater Reservoir,
rural records from upstate New York State, USA. Data to
2000
Little
Falls City Reservoir, New York, USA. Data to 1996
Utica,
NY, USA. This station is located 7 miles west of Utica on a rural site
which has remained unchanged
over the whole period of record. Data
kindly supplied by Rich Lupia, a local meteorologist. Data to 1997
Waverly, Ohio, & Huntington, West Virginia.
Station pair for comparison. Data to 2001
West Point & Central Park, New York, NY.
Urban and rural pair for comparison. Data to 2001
U.S.A. - Southeast
Eastman & Glenville, Georgia,
USA. Data to 2000
Florida Five rural stations -
Arcadia, Everglades, Fernandina Beach, Inverness, and St Leo. Data to 1998
Lexington,
Kentucky, USA. Data to 1995
Mississippi & Alabama -(Meridian & Highland).
Data to 2003
Pontotoc Experimental Station, Mississippi, USA. Data to 2000
Scottsboro & Valley Head, Alabama, USA. Summer
mean temperatures. Data to 2000
Tennessee, Three rural stations, Lewisburg,
Dickson, & Crossville. Data to 1998
Waynesville & Highlands,
North Carolina, USA. Data to 2000
U.S.A. - Mid West
Clarinda, Albia & Toledo, southern
Iowa. Data to 1999
Clinton, Missouri, & Bush Field, Georgia, USA. The
namesakes of the recent presidents. Data to 2000
Fairmont, Minnesota, USA. Seasonal and annual
temperature. Data to 2000
Hannibal, Missouri, and Quincy, Illinois. Photo of
Hannibal on the west bank of the Mississippi. Data to
2002
Fort Scott, Kansas and Lamar, Missouri. Data to 2000
Southern Iowa, USA. Three rural stations,
Clarinda, Albia & Toledo mutally validate each other. Data
to 1999
Jefferson Water Plant and Truman Dam, Missouri,
USA. A rural station pair. Data to 1999
Spickard, Mount Ayr, & Conception,
northern Missouri, USA. 3 stations for comparison. A 3-station average graph for all three. Data to 2001
St. Cloud, Minnesota, USA. Data to 1999
U.S.A. - Plains
Albany & Dublin, Texas. Data to 2000
Dodge
City, Kansas, USA, the heartland of the Old West. Also
summer temperatures only. Data to 2001
Eagle
Pass, Texas, USA. Data to1998
Hallettsville & Danevang, Texas,
USA. Two rural stations west and southwest of Houston. Data to 2000
Lamar,
Colorado, USA. This station is in the high plains region of the mid-west. Data to 1999
Lampasas,
Texas, USA. This station is `deep in the heart of Texas', about 100 miles
NNW of Austin. Data to 1998
Liberty & Houston United, Texas. Data to 2001
Newkirk, Kay County, Oklahoma, USA.
Kay County has the greatest number of recorded tornadoes than any other
county
in Oklahoma, a state with the greatest number of tornadoes per unit area in the
US. Data to 1999
North
Platte & Medicine Bow Nebraska, USA. A pre-1935 warming,
but a neutral trend since then. Data to 1999 Nebraska, USA. A pre-1935 warming,
but a neutral trend since then. Data to 1999
Perry & Kingfisher, Oklahoma, USA. Data to 2000
Rocky
Ford, Colorado, USA, in the High Plains of south-eastern Colorado.
Data to 1995
Sedan (Kansas) & Cherokee (Oklahoma).
Two small stations either side of the state borders. Data
to 2000
Western Oklahoma, USA. Three
stations - Weatherford, Hobart & Altus. Data to
2001
U.S.A. - Mountains
Ashton,
Idaho, USA. Data to 1998
Basin,
Wyoming, USA. Data to 1998
Boulder, Denver, & Cheesman,
Colorado. Boulder is the home of NCAR. Data to
2001
Childs,
Arizona, USA. Data to 1998
Lander,
Wyoming, USA. Data to 1999
Laramie, Wyoming, USA. A very
long 100+ year record. Data to 2000
Northern Utah, USA. Three stations, Como Springs,
Utah Lake Lehi and Snake Creek. Map. Data to 2000
Orogrande,
New Mexico, USA. Located south of Alamogordo. Data
to 1999
Southern Utah, USA. Three stations,
Kanab, Alton and Parowan Power Plant. Data to 2001
Tombstone,
Arizona, USA. Data to 1998
Yellowstone
National Park, Wyoming, USA. Two stations shown here, Lake Yellowstone
in the centre of the park
and Mammoth at the northern end. Data
to 1998
U.S.A. - Pacific
Blaine & Olga, Washington, USA, both stations in the
northwest of the state, Data to 2001
Cascadia, Three Lynx & Bend, Oregon,
USA. A trio of stations for cross-validation. Data to 2000
Cedar
Lake, Washington state, USA. A cooling trend during the 20th century. Data to 1998
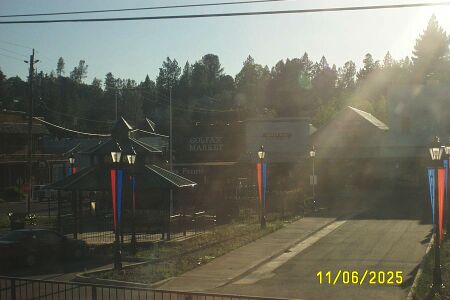
Colfax,
California, USA. Photo of Colfax. Data to 2000.
Davenport,
Washington, USA. Data to 1998
Death Valley, California, USA. Season
and annual temperature. The
hottest place in the USA.
See also this article on
Badwater,
Death Valley Data to 2001
Napa & Willows, California, USA. Actually, Napa is
closer to San Francisco than Santa Rosa (previous)
and shows
a steady urban warming compared with rural
Willows. Data to 2000
Santa Cruz, California, USA. Sits on
the north coast of Monterey Bay, 60m SSE of San Francisco. Data
to 2000
Santa Rosa & Willows, California, USA. Santa
Rosa is a small city in northern California, 50 miles north of
San Francisco and Willows is a rural station 30 miles
further north. Data to 2000
Snoqualmie
Falls, Washington state, USA. Data to
1998
Yosemite
National Park HQ, California, USA. Data
to 1998
Central
& South
America, West Indies
Cartagena & Barranquilla, northern
Colombia. Data to 2002
Islas Juan Fernandez,
Chile. Offshore island. Data to 1999
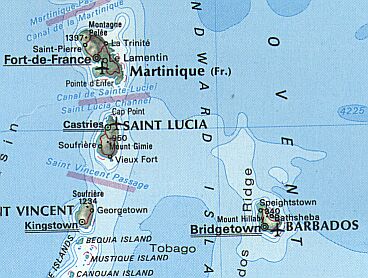
Martinique & Barbados, West Indies. Four
stations with inconsistent records. Map. Data to 2000
Nassau, Bahamas. Data
to 2000
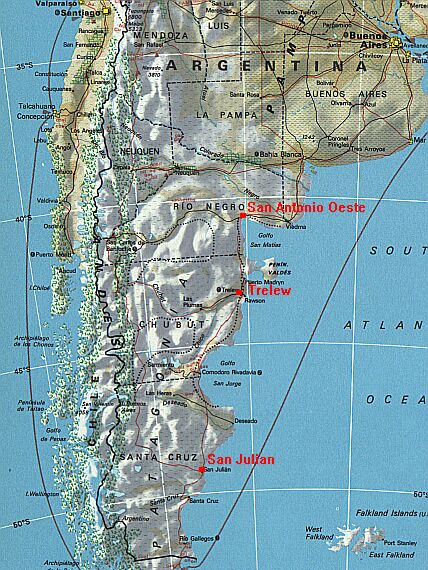
Patagonia,
Argentina. Three stations, Trelew, San Antonio Oeste, and Viedma. Map. Data to 2000
Patagonia, Argentina. Three
stations, San Julian, with Trelew and San Antonio Oeste. Map. Data to 2001
Pehuajo & Santa Rosa,
Argentina. Two rural stations inland from Buenos Aires. Data to 2000
Pilar Observatory and Chepes, Argentina.
Pilar is rural and under scientific supervision. Data
to 2002
Punta
Arenas, Chile, is the southernmost city in the world, near the southern
tip of South America. Data to 1999
San Fernando de Apure, Venezuela. A
rapidly growing city station 100 miles south of Caracas. See also a 20-year
extract of data which shows data fragmentation
problems, typical of third world data. Data to 2001
San
Juan, Puerto Rico. This is an urban station in the Caribbean, but it
is compared on the graph with nearby
rural stations Fajardo and Juncos,
both of which do not show the warming trend exhibited at San Juan.
It demonstrates clearly the effect
urbanisation has in skewing temperature data. Data
to 1999
San Juan updated to 2002, shows a distinct cooling since
1980. Data to 2002
Ushuaia, Artgentina and Punta Arenas, Chile. Both
at the southern tip of South America. Map. Data to 2001
The North Pacific Ocean
Kauai,
Hawaiian Islands, Pacific Ocean. Data to 1999
Majuro,
Marshall Islands, northwestern Pacific Ocean. Data to 1995
Yap
Atoll & Koror, Palau Islands compared.
Both locations are in the western Caroline Islands of the
northwest Pacific. Being adjacent island
groups, similar trends would be expected. Data to 1995
Africa & The Indian Ocean
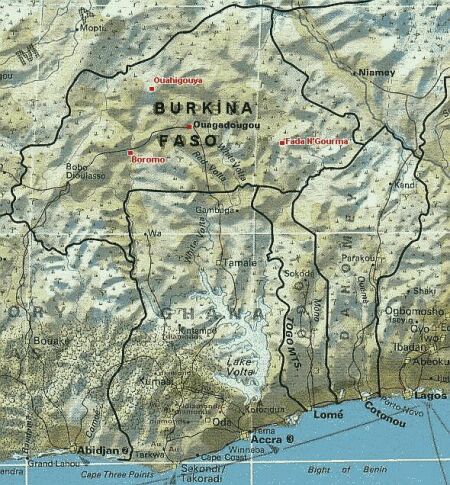
Burkina Faso. A
country in the Sahel region of Africa. Four stations including the
capital, Ouagadougou. Map.
Data to 2001
Calvinia
and Capetown, South Africa. Calvinia is a small town a
few hundred km NNE of Capetown. Data to
1999
Capetown, South Africa.
data to 2003
Dar-es-Salaam, Tanzania, East
Africa. A seaport facing the Indian Ocean. Data to 2000
Indian Ocean Islands. Three stations
- Plaisance (Mauritius), St Brandon, and Rodrigues. Map.
Data to 2000
Johannesburg International Airport (Jan
Smuts), South Africa. Graph shows both adjusted and unadjusted
data.
(Data to 2001
Kimberley & Bloemfontein,
South Africa. Data to 2001
Madagascar. Antananarivo, Tamatave and
Majunga, three cities in Madagascar. Data to 2000
Marrakech (Morocco) & Nouakchott
(Mauritania). Northwest Africa. Map. Data to 2000.
Niamey, Niger. On the southern edge
of the Sahara. Data to 2001
Zinder & Maine-Soroa, Niger, West
Africa. On the southern rim of the Sahara. Data
to 2001
Australia
Adelaide,
South Australia. An urban station which unusually for a city shows a cooling. Data to 1999
Alice Springs, Northern
Territory, Australia. The Alice is in the centre of Australia. Data to 2000
Brisbane, Queensland. Unusually for a city, this
station shows a cooling. Data to 2001
Burnie, Tasmania. Relative
mean sea level 1984-2002. No sea level rise evident.
Data to 2002
Canberra
% Wagga Airports, Australia. Two records on one graph, one very urban,
one very rural. Data to 1999
Cape
Otway, Victoria, Australia, located at the western end of Bass Strait.
Data to 1992
Charleville & Longreach, Queensland,
Australia. Both inland stations. Data to 2001
Coffs Harbour, New South
Wales. Lies on the coast about halfway between Sydney and Brisbane. Map. Data to 2000
Darwin,
Northern Territory, Australia. Bureau has adjusted
the recent years due to changes in procedures.
Data to 2002
Fort Denison (Sydney), Australia. Relative mean sea
level. An artificial datum shift in the late 1940s is clearly evident
Data to 2000
Gabo
Island, Victoria, Australia, located at the eastern end of Bass Strait.
Data to 1992
Geraldton & Giles,
Western Australia. Map. Data
to 1999
Kalgoorlie, Esperance, and Albany,
Western Australia. Map.
Data to 2002.
Launceston & Hobart Airports,
Tasmania, Australia. Map. Data to
2002
Mount Isa (QLD) and Tennant Creek (NT),
northern Australia. See the chart itself then see how CRU
misrepresents this
region as warming rapidly when the reality is quite
different. Data to 2002
Mildura and Adelaide Airports, Australia.
Comparison of trends. Data to 2001
Mildura and Cobar, Australia.
Comparison of trends. Data to 2002
Northern Australia - Darwin (post 1941), Halls Creek and
Gove Airport, the last two are rural. Data to 2000
Thursday
Island, Queensland, Australia, at the northernmost tip of Australia.
Data to 1992
Western Australia stations. Kalgoorlie,
Albany, Esperance, Giles & Geraldton. Map. Data to 2000
Wilson's
Promontory, Victoria, Australia, at the southernmost point of the Australian
mainland,
facing directly onto Bass Strait. Data to
1992
The South Pacific
Chatham
Island, New Zealand, lies 1,000 km east of New Zealand in the Pacific
Ocean. Data to 1992
Christchurch & Invercargill, New
Zealand, in the South Island. Data to 2001
Easter
Island in southeast Pacific Ocean, half-way between New Zealand and
South America. Data to 1999
Funafutu,
Tuvalu, south Pacific Ocean. Data to 1995
Hokitika,
New Zealand lies on the west coast of New Zealand's South Island, directly
facing the
Tasman Sea and the Roaring Forties circulatory
winds. Data to 1995
Invercargill, Campbell Island
& Macquarie Island, Southern Ocean, plus map,
Data to 2000
Islas
Juan Fernandez, Chile. Lies 500 miles west of Santaigo in the Pacific
Ocean. Data to 1999
Lord
Howe Island, Australia, lies 500 km east of Australia, in the Tasman
Sea. Data to 1995
Macquarie
Island, about 1,500 km southeast of Tasmania deep in the Southern Ocean. Data to 1999
Norfolk Island, Pacific Ocean, an overseas territory of Australia.
Also, location map. Data to 2000
Noum�a,
the capital city of New Caledonia in the southwestern Pacific Ocean. Data
to 1994
Papeete,
the capital city of Tahiti in French Polynesia in the central South Pacific. Data to 1999
Rapa,
in the Austral Islands, the most southerly group of French Polynesia, South
Pacific Ocean. Data to 1995
Rarotonga,
Cook Islands, South Pacific Ocean. Data to 1995
Tarawa
Atoll, Kiribati, Pacific Ocean. Data to 1992
Wallis
Island, French Wallis & Futuna, northeast of Fiji, South Pacific
Ocean. Data to 1995
Willis
Island, Coral Sea, Australia, 300 miles east of Cairns, Queensland. Data to 2001
The South Atlantic
Gough Island, South Atlantic, 1,500 miles w-sw of
Capetown. Annual and seasonal temperatures. Data
to 2001
Signy (British), and Orcadas (Argentinian), South Orkney Islands. These islands lie deep in the Southern Ocean,
just
north of the Antarctic Peninsula, a region about which warming claims
have frequently been made.
Map of the region.
Data to 2000
Stanley,
Falkland Islands, lies deep in the South Atlantic, 200 miles east of southern
Argentina. Data to 1980
The Antarctic Scientific Bases
 |
Amundsen-Scott
Base, South Pole, Antarctica, as far south as you can get, right in
the centre of the Antarctic continent. If
it can't warm here, it can't warm anywhere. CO2 data obtained at the South Pole
is also shown for purposes of comparison with the temperature. Data
to 2000
Casey
Station, Antarctica. An Australian base on the eastern Antarctic
coast. Seasonal and annual data to 2000
Davis
Station, Antarctica. An Australian base on the
eastern Antarctic
coast. Data to 1999
Halley
Bay, Antarctica, a British base on the western
Antarctic coast facing
the Weddell Sea. Data to 2000
Mawson
Station, Antarctica. An Australian base on
the eastern Antarctic
coast. Data to 1999
Mirny Station, Antarctica. A Russian base on
the same coast as Davis And Casey. Map. Data to 2000 |
Scott
Base, Antarctica, a New Zealand base on the coast of the Ross Sea,
due south of NZ. Data to 1993
Signy & Orcadas, South Orkney
Islands. A British and an Argentinian station close together. Map. Data to 2000
Syowa (Japanese) and Molodezhnya (Russian). On the coast of
Enderby Land. Data to 2000
Vostok
Base, Antarctica. This is a Russian base deep in the Antarctic continent
at the top of the ice plateau,
3,420 metres above sea level. Vostok
holds the dubious distinction of having recorded the coldest
temperature ever measured on Earth,
-89.2 deg C. in
1983. (1983 was a `warm' year globally). Data
to 1999
More graphs will be added
to this list, and existing graphs will be updated, as time permits. |