|
Trends in Pacific Decadal Oscillation by Schroeter Institute for Research in Cycles of Solar Activity
Introduction The Pacific Decadal Oscillation (PDO) is a long-lived ENSO-like pattern of Pacific climate variability (Tanimoto et al., 1993; Zhang et al., 1997). ENSO (El Niņo/La Niņa + Southern Oscillation) and PDO have similar spatial and temperature patterns, but show a different behaviour in time. While ENSO events are inter-annual phenomena, the PDO covers decades. A full oscillation, comprising a warm and a cool phase, may extend over more than 50 years. Another dissimilarity is that the primary climatic effects of the PDO concentrate on the North Pacific with only secondary signatures in the tropics, whereas ENSO events dominate the equatorial Pacific and have only secondary effects in other parts of the Pacific (Mantua et al., 1997). In parallel with the ENSO phenomenon, the extreme phases of the PDO have been classified as warm or cool, as defined by sea surface temperature (SST) anomalies in the northeast and tropical Pacific Ocean. The PDO index has positive values when the SST is anomalously warm along the coast of North- and Central America and the equator and cool in the interior North Pacific. The index is negative when the SST pattern is reversed. The PDO then forms a giant horseshoe-shaped arc of warmer-than-normal water off the coast of Japan, enclosing a wedge of cooler-than-normal water near the equator (Trenberth and Hurrell, 1994). The difference in sea surface temperature, going along with positive or negative PDO regimes, is not more than1° - 2°C, but the affected area is huge. So the temperature changes have a big impact on the climate in North America. The change in the location of warm and cold water in the Pacific alters the path of the jet stream, the conveyor belt for storms across the continent. Wintertime surface air temperature along the Gulf of Alaska, and SST near the coast from Alaska to southern California varies with the PDO (Mantua et al., 1997). During positive PDO years the annual water discharge in the Skeena, Fraser, and Columbia Rivers is on average up to 14 % lower than during negative PDO years. In contrast, discharge from the Kenai River in the central Gulf of Alaska is on average 18 % higher than during PDO years with negative polarity. The PDO is positively correlated with wintertime precipitation over northern Mexico and south Florida. A negative correlation exists with precipitation over much of the interior of North America and over the Hawaiian Islands (Mantua et al., 1997). Generally, the responses of climate anomalies to warm (positive) and cool (negative) regimes of the PDO are similar to those caused by El Niņo and La Niņa (Latif and Barnett, 1996).
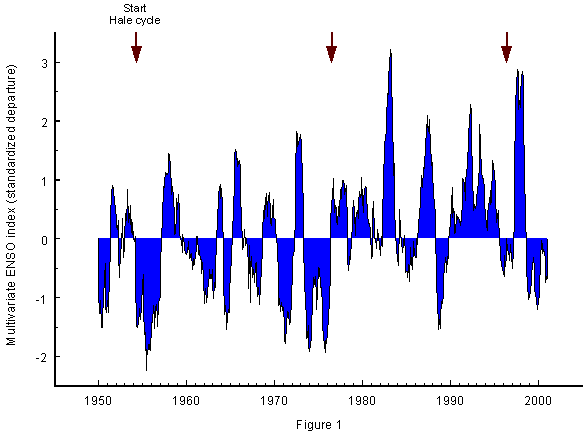
Alternating preponderance of El Niņo and La Niņa There is a noticeable correlation ( |r| = 0.38) between PDO and ENSO. So it seems conceivable that the state of the inter-decadal PDO constrains the envelope of the inter-annual ENSO variability (Mantua et al., 1997). Different periodicities with different underlying processes could be involved. Minobe (1997) has shown that the PDO fluctuations in the 20th century concentrate most of their energy on two different ranges of periodicities from 15 to 25 years and from 50 to 70 years. The first range includes the 22-year cycle of solar activity. So I hypothesize that this cycle is associated with ENSO events such that emerging patterns, covering decades, reflect the rhythm of the 22-year solar cycle. The true sunspot cycle is the magnetic Hale cycle with a mean length of 22 years. The magnetic
The connection can be evaluated quantitatively by investigating to which degree the MEI means in consecutive Hale cycles deviate from each other while their positive and negative signs form a consistent alternating pattern. A bootstrap analysis based on the t-test yields P < 0.0000001 for the two complete Hale cycles shown in Fig. 1. The sceptical null hypothesis that the MEI means of these cycles show no significant difference can be dismissed. The distributions in the preceding Hale cycles back to the initial phase 1889, too, yield highly significant results, though on a lower level (P < 0.001). This could be due to deteriorating quality of earlier observations. If the pattern holds, a preponderance of La Niņa is to be expected during the Hale cycle that began in 1996. So far, one El Niņo is faced with two La Niņas, the second of which is still continuing. A predominance of La Niņas, lasting 22 years, would have a strong effect on global temperature comparable to the cool period in the sixties and early seventies when temperatures were falling in spite of a steep increase in anthropogenic carbon dioxide. Predominance of El Niņo or La Niņa in a Hale cycle does not exclude that isolated strong ENSO events occur which do not belong to the dominant type. The respective state of the PDO may play a role here.
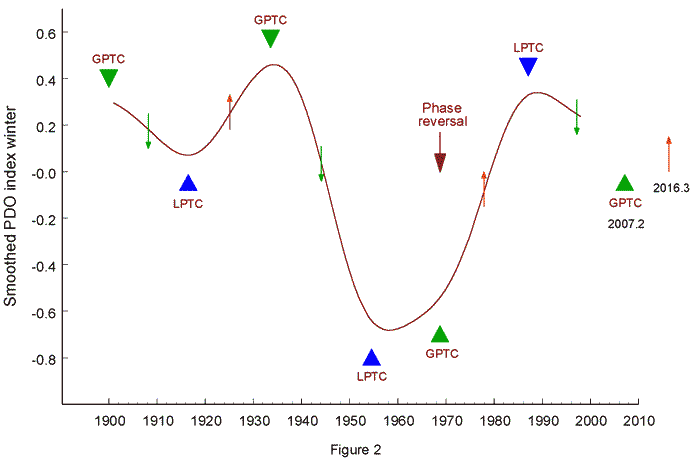
Long solar motion cycles and PDO Partially, Hale cycles with accumulations of El Niņos and warm regimes of the PDO coincide. This also happens with aggregations of La Niņas in Hale cycles and cold regimes of the PDO. A nearly perfect coincidence, however, is the exception. The Hale cycle 1976 - 1996 with predominant El Niņos nearly coincides with the warm PDO regime 1977 - 1997, but the warm regime 1925 - 1946, for instance, only partially matches the Hale cycle 1933 - 1954 with prevailing El Niņos. Moreover, periodicities around the length of the Hale cycle represent only the first prominent range found by Minobe (1997); the second aggregation falls at the range 50 to 70 years. So I investigated a potential relationship of the PDO with a long solar motion cycle. Solar motion cycles have been shown to regulate ENSO events, the North Atlantic Oscillation (NAO), extrema in global temperature anomalies, and also droughts, rainfalls, and floods (Landscheidt, 1983, 1990, 1995, 1998 a, 1999 a, 2000 a, 2001). Thus, it is imaginable that they, too, have an effect on the PDO. Mantua (2001) provides standardized values of a PDO index derived from monthly SST anomalies in the North Pacific Ocean poleward of 20°N. I chose the winter data available for the years 1900 - 1998, as the PDO signal in winter is stronger than in the other seasons. These data were subjected to 20-year moving window Gaussian kernel smoothing (Lorczak) to set off periodicities longer than 20 years.
Fig. 2 shows the result. Maxima of the curve indicate peaks of warm PDO regimes and minima the Perturbations in the sinusoidal course of this cycle recur at quasi-periodic intervals and mark zero phases of a perturbation cycle (PC) with a mean length of 35.8 years (Landscheidt, 2000 a). As to details, I refer to Fig. 2 in my on-line paper "Solar Eruptions Linked to North Atlantic Oscillation" (Landscheidt, 2001). The second subharmonic (71.6 years) of the PC comes close to the upper limit of the longer periodicities found by Minobe (1997). In Fig. 2 presented here, the zero phases of PC are marked by green triangles and the label GPTC (Greatest perturbation in torque cycle). Blue triangles labeled LPTC (Least perturbation in torque cycle) mark phases of minimal perturbation.
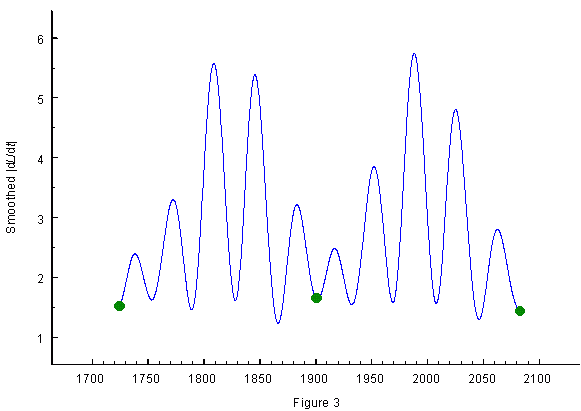
Another approach to the 35.8-year cycle is presented in Fig. 3. It has been shown that absolute values of the torque cycle (|dL/dt|) form a shorter cycle that plays, e.g., a major role in solar forcing of the North Atlantic Oscillation (Landscheidt, 2001) and discharges in river catchment areas (Landscheidt, 2000 b, 2000 c). When a Gaussian low-pass filter suppressing wavelengths shorter than 9 years is applied to |dL/dt|, new oscillations emerge as shown in Fig. 3 for 1721 - 2077. Minima in the smoothed |dL/dt|-curve are identical with phases GPTC and maxima with phases LPTC. So it is easy to compute the precise dates of these phases. GPTCs fall at 1899.9, 1933.6, 1968.8, and 2007.2. The LPTC dates are 1916.5, 1954.6, 1987.1, and 2025.4. Green circles indicate the initial phases of a long perturbation cycle (LPC) of 178.8 years which is important in solar-terrestrial relations covering centuries. It also indicates potentials for phase reversals, as will be shown. Before the phase reversal in 1968, marked in Fig. 2 by an arrow, all GPTC phases coincide with maxima and all LPTC phases with minima of the smoothed PDO index. From 1968 on, this relationship is reversed. Due to this phase reversal, the regular negative effect of LPTC 1954.6 was intensified by the additional negative effect of GPTC 1968.8 switching to a reversed polarity. This seems to explain the exceptionally long and strong cold regime observed between 1947 and 1976. LPTC 1987.1, going along with a maximum, confirms the phase reversal. The next minimum (negative cool extremum) is to be expected around 2007.2. It should be less deep than the preceding one. When this forecast is checked in the years around 2007, the data should be processed in the same way as in this investigation. Phase instabilities in solar-terrestrial cycles pose complicated problems. Many scientists do not even see the phase shift and believe that a clear-cut connection has disappeared though nothing but the sign of the correlation has changed. I have shown that phase reversals or similar instabilities may occur in the 16-year torque cycle or its absolute version, the 8-year |dl/dt|-cycle, when their zero phases coincide with a zero phase GPTC in the 36-year cycle higher up in the hierarchy of solar motion cycles (Landscheidt, 1995, 1998 a, 1998 b, 1999 a, 2000 a) . Zero phases are involved because we have learnt from experimentation with electrical or mechanical control equipment that at nodal points, where the response of the system is zero, the phase can shift by pi radians (Burroughs, 1992). The phase reversal around 1968 coincides with a zero phase GPTC being part of the perturbation In the current long perturbation cycle the point 0.39 falls at 1969.6, just the time of the phase reversal indicated in Fig. 2 and Fig. 4. It coincides with GPTC in the PC. If this is a valid relationship, another phase instability should have occurred around 1900, as this is the date of a zero phase in the long perturbation cycle (LPC). Moreover, phases of instability induced by the LPC should be rare events because of the inter-centennial character of this cycle.
Forecast of regime shifts in PDO The course of the curve in Fig 2 confirms observations (Mantua, 2000) that a shift from a positive to a negative PDO regime occurred in 1998. Such regime shifts from warm to cold and from cold to warm are of great importance for the climate in the Pacific region and diverse teleconnections. They even have an effect on the behaviour of individual ENSO events. Before 1977, El Niņos tended to develop first along the coast of South America and then spread westward. From 1977 on El Niņos developed in the central Pacific and spread eastward (Wang, 1995). Observed polarity reversals occurred in 1925, 1947, 1977, and 1998. The first three of these dates were established and confirmed by intervention analysis, an extension of the ARIMA model (Mantua et al., 1997). Not only the PDO extrema, but also the regime shifts can be read from Fig 2. They are indicated by small arrows pointing upwards (red: shift from cold to warm) or downwards (green: shift from warm to cold). The regime shifts fall just at the midpoint between GPTC and LPTC phases with opposite polarity. The computed dates are 1908.2, 1925.1, 1944.1, 1977.9, and 1997.2. They are rather close to the observed dates 1925, 1947, 1977, and 1998 given in the literature, especially when it is taken into account that the mean interval between regime shifts of the same polarity is 52.9 years. This interval is a main feature as it describes a full cycle of swings from warm to cold and cold to warm and vice versa. Rather close to the length of this cycle, at 52.1 years, emerges the strongest frequency peak in a maximum entropy spectral analysis (Burg algorithm, 40 filter coefficients) of the raw PDO winter data. The second strongest peak at 21.5 years is close to the mean length 21.1 years of the Hale cycle in the investigated period. Specialists dealing with the PDO emphasize that the causes of this oscillation are not known and that there is no way to see how PDO extrema and especially those abrupt regime shifts from warm to cold or from cold to warm could be predicted (Mantua et al., 1997). This is true only as long as the Sun's dominant role in climate change is ignored. Fig. 2 shows that a forecast is easy. The next regime shift from cold to warm is to be expected around 2016.3, the midpoint between GPTC 2007.2 and LPTC 2025.4.
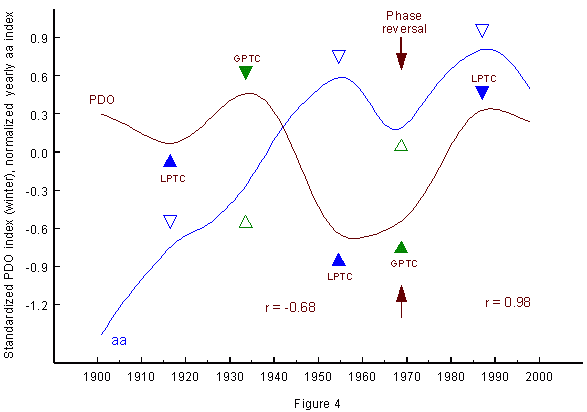
Geomagnetic index aa and PDO Sceptics might object that the phase reversal around 1968/1969 is an ad hoc argument not substantiated by further evidence. Fig. 4 shows that this is not true.
I have demonstrated that there is a close connection between energetic solar eruptions on the one hand and ENSO and the NAO on the other (Landscheidt, 1999 a, 2000 a, 2001). So it could be that solar eruptions, too, have an impact on the PDO. Not all strong solar eruptions have an impact on the near-Earth environment. The effect at Earth depends on the heliographic position of the eruption and conditions in interplanetary space. Indices of geomagnetic activity measure the response to those eruptions that actually affect the Earth. Mayaud's aa index (Mayaud, 1973) is homogeneous and covers more than a century. So I subjected the aa index like the PDO to 20-year moving window Gaussian kernel smoothing (Lorczak) and compared it with the PDO. Fig. 4 shows the result. Filled green and blue triangles mark phases GPTC and LPTC in relation to the brown PDO curve. Open green and blue triangles show how the same phases are related to the blue aa curve. It is obvious that the aa data, too, are affected by the phase reversal, indicated by arrows. After the reversal, there is a close positive correlation (r = 0.98) between aa and PDO which explains 96 % of the variance. Before the phase shift the correlation is negative ( r = -0.68). It is not quite as strong as the positive correlation, as the aa maximum around 1916.5 and the aa minimum around 1933.6 are not fully developed, though recognizable. This seems to be related to the steep rise of the aa curve between 1900 and the fifties. Bootstrap analysis shows that both of the correlations are significant far beyond the 0.001 level. The high correlation after 1968 shows clearly that contrary to IPCC's Third Assessment Report and recent publications in the literature (Tett et al., 1999) the Sun's impact on climate has been as strong in recent decades as ever. This is confirmed by further investigations covering diverse climate phenomena (Landscheidt, 1998 b, 2000 a, 2000 b, 2000 c, 2000 d).
Outlook In this early stage of development of a completely new interdisciplinary approach it cannot be expected that there is a detailed physical explanation of the results, especially as the fields of solar activity and climate change have not yet reached the stage of full-fledged theories and the causes of the PDO are still unknown. As to first tentative explanations of the connection between solar eruptions on the one hand and the related oscillations ENSO and NAO on the other I refer to earlier publications (Landscheidt, 1999 a, 2000 a). Forecast experiments are the best way to check whether science is sound. Such forecasts are available for the next crucial phases in the course of the PDO around 2007 (Coolest period in a cool regime) and 2016 (Regime shift from cold to warm). Wait and see will be the procedure in the second part of the experiment. References Burroughs, W. J. (1992): Weather cycles real or imaginary? Cambridge University Press, p. 149. Landscheidt, T. (1983): Solar oscillations, sunspot cycles, and climatic change. In: McCormac,
B. M., ed.: Landscheidt, T.(1990): Relationship between rainfall in the northern hemisphere and impulses of the torque in the Sun's motion. In: K. H. Schatten and A. Arking, eds.: Climate impact of solar variability. Greenbelt, NASA, 259-266. Landscheidt, T.(1995): Global warming or Little Ice Age? In: Finkl, C. W., ed.: Holocene cycles. A Jubilee volume in celebration of the 80th birthday of Rhodes W. Fairbridge. Fort Lauderdale, The Coastal Education and Research Foundation (CERF), 371-382. Landscheidt, T. (1998 a): Forecast of global temperature, El Niņo, and cloud coverage by astronomical means. In: Bate, R., ed.: Global Warming. The continuing debate. Cambridge, The European Science and Environment Forum (ESEF), 172-183. Landscheidt, T. (1998 b): Solar activity : A dominant factor in climate dynamics. http://www.john-daly.com/solar/solar.htm. Landscheidt, T. (1999 a): Solar activity controls El Niņo and La Niņa. Landscheidt, T. (2000 a): Solar forcing of El Niņo and La Niņa. ESA Special Publication 463, 135-140. Landscheidt, T. (2000 b): River Po discharges and cycles of solar activity. Hydrol. Sci. J. 45, 491-493. Landscheidt, T. (2000 c): New confirmation of strong solar forcing of climate. http://www.john-daly.com/po.htm Landscheidt, T. (2000 d): Sun's role in the satellite-balloon-surface issue. http://www.john-daly.com/solar/temps.htm.. Landscheidt, T. (2001): Solar eruptions linked to North Atlantic Oscillation. http://www.john-daly.com/theodor/solarnao.htm. Latif, M. and Barnett, T. P. (1996): Decadal climate variability over the North Pacific and North America: Dynamics and predictability. J. Climate 9, 2407-2423. Mantua, N. J., Hare, S. R., Wallace, J. M, and Francis, R. C. (1997): A Pacific decadal climate oscillation with impacts on salmon production. Bull. Am. Meteor. Soc. 78, 1069-1079. Mantua, N. J. (2000): The Pacific Decadal Oscillation and climate forecasting for North
America. Mantua, N. J. (2001): PDO index. ftp://ftp.atmos.washington.edu/mantua/pnw_impacts/INDICES/PDO.latest. Mayaud, P. N. (1973): A hundred year series of geomagnetic data. IUGG Publications Office, Minobe, S. (1997): A 50 - 70 year climate oscillation over the North Pacific and North America. Geophys. Res. Lett. 24, 683-686. Tanimoto, Y.N., Iwasaka, N., Hanawa, K., and Toba, Y. (1993): Characteristic variations of sea surface temperature with multiple time scales in the North Pacific. J. Climate 6, 1153-1160. Tett, S. F. B., Stott, P. A., Allen, M. R., Ingram, W. J., Mitchell, J. F. B. (1999): Causes of twentieth-century temperature change near the Earth's surface. Nature 399, 569-572. Trenberth, K. E. and Hurrell, J.W. (1994): Decadal atmosphere-ocean variations in the Pacific. Climate Dynamics 9, 303. Wang, B. (1995): Interdecadal changes in El Niņo onset in the last four decades. J. Climate 8, 267-285. Wolter, K. and Timlin, M. S. (1998): Measuring the strength of ENSO. Weather 53, 315-324. Zhang,Y., Wallace, J. M., and Battisti, D. S. (1997): ENSO-like interdecadal variability: 1900-1993. J. Climate 10, 1004-1020. |


