Tasmanian Sea Levels:
The `Isle of the Dead' Revisited
by John L. Daly
2nd February 2003
Part 1
![]()
|
Summary Recent publicity arising from a study by the Universities of Southampton and Tasmania [1] of an old sea level benchmark at Port Arthur, Tasmania, claims `dramatic' sea level rise of about 13cm since the mark was first struck back in 1841.
several times in his 1846 book [3] that the mark was placed at MSL (as he estimated it to be), not at a point 44.5cm above,
near the high tide point, as claimed by the study.
Other evidence surrounding the original placing of the benchmark is less clear, but we do have one positive measurement of where the benchmark stood relative to sea level taken in 1888 by the then Government meteorologist, Commander J. Shortt R.N.
He found the mark to be 34cm above sea level - only 2½ cm different to its current
position [7] [5].
Introduction This report has been prompted by the recent publication of a paper by Pugh et al [1], giving details of a 7-year study by the Universities of Southampton and Tasmania into the origins, history, and current height of a sea level benchmark etched onto a cliff on a small island in Port Arthur Harbour, Tasmania, in 1841. The authors claim the benchmark was not struck at Mean Sea Level (MSL) as described by the man responsible for putting it there, Antarctic explorer Captain Sir James Clark Ross, acting in association with Thomas Lempriere (a senior official of the Port Arthur convict colony), but was rather struck closer to high tide, the mark estimated by Pugh et al. to be 44.5 cm above MSL as it existed in 1841. Since they report that the mark is now 31.5 cm above current MSL, as determined from modern tide gauge data, they propose that a sea level rise of 44.5 - 31.5 cm = 13 cm has therefore occurred since 1841. Of this, they further propose that the current land uplift rate would raise the land 3.2 cm over the same period, making a net sea level rise of 13 - 3.2 = 9.8 cm. There are a number of height positions relative to MSL in 1841 to which the benchmark might have been struck - at 44.5 cm above as claimed by Pugh et al., or 14 cm above as suggested later in this report or at the actual 1841 MSL itself. Any such scenarios involve unresolved issues with available evidence, the most serious of which is the Pugh et al scenario which completely contradicts the written account given by Ross in his 1847 book [3]. Between 1841 and the modern era, we have only one measurement made of the height of the benchmark relative to sea level, and that was organised by Commander J. Shortt R.N., the Government Meteorologist of the day, on 24th February 1888. The height he reported is only 2½ cm different to the height today, a sea level rise of only an inch in 114 years. It is the Shortt measurement of 1888 which is critical for any scenario. In the case of Pugh et al., they have applied a very long error bar to the Shortt measurement, 26 cm, or about one third of the full tidal range at Port Arthur. It is only through this wide error bar that the scenario favoured by Pugh et al works at all as the sea level rise they propose depends on their sea level trend line passing through the extreme lower end of their 1888 error bar. A narrower error bar would require a sea level rise between 1841 and 1888 of around 10 - 12 cm, much too large for only 47 years during a period of global cooling and against the trend of a gently uplifting coast. This report demonstrates some key problems with the Pugh et al. study and to provide an alternative scenario in Part 2 consistent with the known evidence surrounding the Ross-Lempriere benchmark. |
|
The Ross-Lempriere Sea Level Benchmark Today
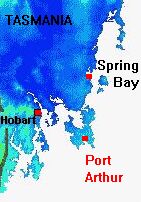
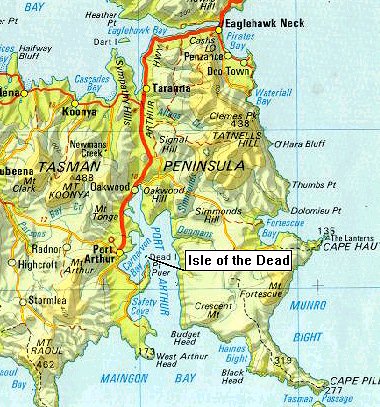
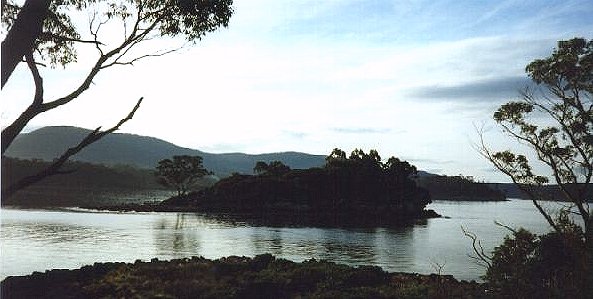
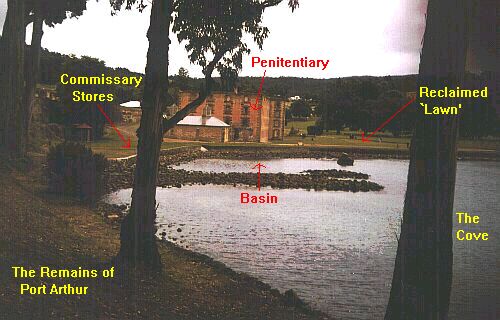
The old convict colony is now a managed Historic Site and comprises the main convict settlement at Port Arthur, a smaller ruin settlement for convict boys at Point Puer, and finally, the `Isle of the Dead', the final resting place of nearly 2,000 people, convicts, children, and free persons, buried there during the convict days of early settlement last century. The Isle of the Dead lies about a kilometre east of Commandants Point and it is here that the 1841 sea level benchmark sits on the north side of the isle. Four locations from the above map are of special interest for our purposes - 1) The Isle of the Dead. The Ross-Lempriere benchmark is located on the north side of this island. 2) The Basin and Stores area. This is where Pugh et al. believe a tide gauge was located in 1841. 3) The CSIRO Tide Gauge. Pugh et al. used this tide gauge to determine modern sea level. 4) The Dockyard. Now a ruin, but another possible
location for the 1841 tide gauge.
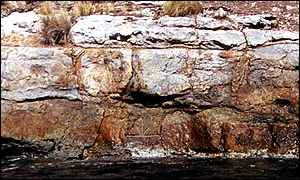
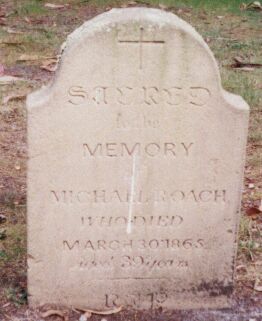
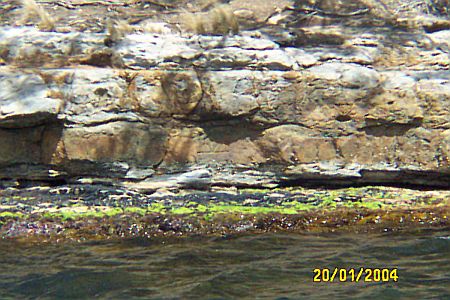
The sea level benchmark engraved there on the north side of the island (facing away from the photo, fig.5) was originally cut on 1st July 1841, by a senior official of the penal colony, Thomas Lempriere, in association with Captain Sir James Clark Ross, the renowned Antarctic explorer, who was visiting Tasmania at the time. Ross was the commander of a scientific expedition to the Antarctic, using two ships, Erebus and Terror, both of which were moored at Hobart between April and July of 1841 during a three-month stopover in Tasmania. It was Ross who set in motion the project to establish a sea level benchmark at Port Arthur, a project fully supported by both the Governor of Tasmania, Sir John Franklin, and the British Colonial Office. In other words, this project was conceived at the highest level. The benchmark they established is still there and in perfect condition -
Sea Level Rise? This estimate of sea level rise made by Pugh et al.
depends critically upon exactly what height relative to MSL (as it existed in 1841) the benchmark was
originally struck to by Ross and Lempriere. It also depends
critically upon a height measurement made of the benchmark by Commander
J. Shortt R.N., the government meteorologist, 47 years later in
1888. As we shall later see, it is the 1888 measurement by Cmdr.
Shortt which is the weakest link in the Pugh et al. scenario of sea
level rise.
The above diagram is reproduced from a similar diagram in the Pugh et al. paper, but drawn to scale marks to show the levels, error bars and years more clearly. It shows the scenario they present of sea level rise. The Ross-Lempriere benchmark is taken to lie at the zero line at the top of the graph, and the changing sea levels are referenced against it. As the diagram shows, they assume the sea level in 1841 to be at -44.5 cm below the benchmark, thus giving a relative sea level rise to the present of 13 cm. As the chart indicates, the scenario of sea level rise depends - (a) on the choice of 44.5 cm as the starting point above MSL in 1841, and (b) on the large error bar of the 1888 Shortt measurement, the extreme bottom of which is needed to allow the rising sea level trend line to pass through to the present. Indeed, at a lecture given by the study authors to explain the results [2], it was pointed out that because there was no evidence from elsewhere in the world that sea levels rose in the mid to late 19th century, then the sea level line from 1841 should really run horizontally to 1890 and then curve sharply upward from there to the present. In light of this, we can modify the timeline graph accordingly -
If that is the case, then the line would have to run horizontally from the upper extreme of the 1841 error bar though the extreme lower tip of the 1888 Shortt error bar. The slightest need to narrow or even raise the Shortt error bar would put the `sea level rise' scenario in considerable difficulty and also call into question the validity of their 1841 benchmark height placement. Their scenario cannot accommodate any land uplift pre-1888 as that would impose a slight sea level fall to 1888, again putting their trend line out of reach of the Shortt error bar.
|
| The Recent Past
The authors were very mindful of the claims of global sea level rise made by the U.N. Intergovernmental Panel on Climate Change (IPCC). It claims a 10 to 20 cm sea level rise since 1900, a point of some controversy, but which Pugh et al. regard as consistent with their result of 13 cm relative sea level rise at Port Arthur. Firstly, can we see recent sea level rise? For Port Arthur, we simply don't know because the CSIRO tide gauge has been operating there only a few years, and mean sea level determination needs 18½ years of data to get a fully accurate figure. This is because it takes that long for all the variations and permutations of lunar and solar cycles to work themselves through one full cycle. However, there are longer-term tide gauges located at Hobart to the northwest and Spring Bay to the north. At the lecture it was stated - "We know that sea level can't change very much between Hobart and Port Arthur. Simple calculations show that it only varies at most 1 or 2 centimetres." [2]. It is this close linkage between Hobart and Port Arthur tides and sea levels which has enabled Pugh et al. to give a figure for current MSL at Port Arthur as being 31.5 cm below the current height of the benchmark. This linkage between Hobart and Port Arthur makes sense because both harbours are adjacent to each other and both face south, opening out directly to the Southern Ocean. Spring Bay to the north is different in that it sits on the east coast of Tasmania with a sea access facing east toward the Tasman Sea. Here are the sea level histories for Hobart and Spring Bay, plotted from data published online by the Permanent Service for Mean Sea Level (PSMSL). [18] |
Fig.9 - Monthly Relative Sea Level at Hobart and Spring Bay [18]
| Hobart has the slightly longer record of the two and
neither shows any general tendency for sea level rise - a lot of variability certainly,
but no significant upward trend. The lowest sea level recorded at both sites
was quite recently - late 1997, right in the middle of a major El Niño
event, a separate issue which will be returned to later.
From this data, we can confidently conclude that whatever sea level rise may have happened since 1841, none of it happened since 1987 when the Hobart tide gauge data from PSMSL begins. If Pugh et al. were right, then the sea level rise they claim - all of it - must have been pre-1987. This brings us to the work of Bruce Hamon [5], who researched the benchmark well before Pugh et al., publishing a paper on the subject in 1985. Hamon also published his paper well before climate change and sea level rise became a political issue and his paper can therefore be viewed as a fairly neutral assessment on his part. Using the Hobart tide constants as his guide, he determined MSL at Port Arthur to be 36 cm below the level of the benchmark, although he himself put an error range of ±5 cm for any single spot observation - such as the one he himself made. This makes his observation and associated error bar within the latest estimate of 31.5 cm given in the Pugh et al. study. But Hamon did more than merely measure the benchmark relative to MSL in 1985. He proceeded to use Hobart tidal constants to effectively go back in time. Just as tides can be predicted years into the future, once each areas tide constants are known, it is equally possible to predict tides years into the past, many decades even. Hamon took his analysis right back to 1888 when Cmdr. Shortt made his measurement of the benchmark.
|
| The 1888 Height Measurement
Commander J. Shortt R.N. was the government meteorologist of the day. He published government notices regularly in the local press and was a contributor of scientific papers to the Royal Society of Tasmania, the state's premier scientific body. During the early 1880s, and immediately in the wake of the mammoth eruption of Krakatau in August 1883, Tasmania was subjected to over a thousand earth tremors, mostly on the eastern half of the island [9], and Shortt published an analysis of these in 1885 [8]. These tremors were unprecedented in number or scale either before or since. Three years later, Shortt published his paper on the Ross-Lempriere benchmark [7], and explained that it was because of the possible vertical movement of land following such tremors that he decided to measure the height of the benchmark so that future vertical movements of the land, if any, could be accurately tracked. Shortt himself did not do the actual measurement. He requested a local official, `Mr. T. Mason' to do it for him (the same name as the inner cove of the Port Arthur convict settlement - Mason Cove.) According to Shortt - "Mr. Mason, at my request, very kindly ascertained the time of low water on February 24th, 1888, at 11 h. 45 m. a.m., which day corresponds relatively with the moon's age 45 years previously (the day the benchmark was originally struck - 1st July 1841 - JD). At this low water level the mark was found to be 2½ ft. above. This very closely corresponds with the normal difference between these levels of low and high water,...". Clearly this is a `spot' measurement and potentially contains a lot of room for error, amply justifying a large error bar on the timeline graph in the absence of any other information which might narrow down those errors. There are potential errors from the observer himself, there are errors arising from the complex pattern of tides in that region, and there are errors which might arise from meteorological variability such as strong westerly winds making the tides pile up, or atmospheric pressure changes which can raise or depress the local sea level. Any or all of these uncertainty factors calls for a significant 1888 error bar on the timeline graph. With regard to observer error, if the observer was an outsider visiting Port Arthur for the first time, then such an observer would have no idea if the measurement they were making was normal for that location or somehow anomalous due to some local variable skewing the sea level on that occasion. The error bar for such a measurement would have to be very wide in the absence of any application of knowledge about local tides, winds, or pressure. Then we have what we might call an `informed spot measurement', one where the observer already has some of that additional information and acts on it. My photograph of the benchmark (fig 6) represents just one such `informed spot measurement'. In my first report over two years ago on this issue, I estimated the current height of the benchmark to be 30 cm above mean sea level. Since we now know it is 31.5 cm above, that was an error of only 1½ cm on my part. How did I manage to achieve such close accuracy? It could of course be plain luck, but I did choose a day close to the same age of the moon as on the day the benchmark was struck. Next, I checked the National Tidal Facility in Adelaide to find out the times of the tides at nearby Hobart and Spring Bay on the day I intended to visit the Isle of the Dead. From this, I determined the most likely time of mean tide (not itself mean sea level, but close). I even checked the barometric pressure on the day to make due allowance for that also. With that information, I hired a boat and took the photo of the benchmark at the expected time of mean tide. Once there, I found a lot of swell in the vicinity of the cliff where the benchmark was located, but from carefully observing the ebb and flow of that swell, I was soon able to settle visually on where the mean level at any one time was. I took the photo at the time of expected mean tide. When I looked at the photo afterward, I saw that the benchmark was sitting about 40 cm above the water (using the horizontal line of the benchmark - 50 cm - as a guide. See fig.6). Since atmospheric pressure was 1024 mb on the day I did it, thus depressing sea level by nearly 10 cm, I subtracted that 10 cm from the 40 cm visual height to arrive at a figure of 30 cm for the adjusted height. Nothing too difficult or complicated. No ruler or measuring stick, just knowledge of the tide times, moon phase, and the atmospheric pressure and wind. My final answer, 30 cm, ended up only 1½ cm different to the real figure determined at some considerable cost of personnel time and a state-of-the-art tide gauge. If I could do that, it is simply not credible to imagine that someone else with better local knowledge than mine would end up incurring an error bar 26 cm wide. This example is given to show that the claimed difficulties in making a good spot measurement may be over-rated, perhaps for reasons of professional pride rather than any genuine difficulty, and that it is not necessarily inaccurate provided it is integrated with that additional information such as knowledge of tide times, heights, meteorology, and phases of the moon. If I could do it to within 1½ cm, with such simple methodology, there's no reason to suppose a local man with local knowledge, Mr. Mason, could not do equally well or better, especially as he was measuring it from the low tide point and not the more turbulent mean tide that I used. A 5 cm error bar, as suggested by Hamon, to allow for potential observer error is therefore perfectly reasonable in the circumstances. Tidal variability is sufficiently complex at Port Arthur to impose a significant error on Shortt's measurement. However, this was removed by Bruce Hamon and his backward projection of tides. Because Shortt gave the exact date and time of the measurement, 11.45 a.m. on 24th February 1888, Hamon was able to determine where low tide should have been on that day, based on the Hobart tide constants. From that he was able to correct for any error created by tidal variability. He wrote - "Shortt found the mark 2ft 6in (0.76m) above low water, at 11.45 local time on 24 February 1888. Again using the Hobart tide constants, I found the tide at this time to be 0.42 m below mean sea level. Predicted low tide was about 30 minutes later, and only 1 cm lower. " Finally, he
completed the tidal
correction - "Shortt's
observation corresponds to the mark being So, the observer error range is about 5 cm, and tidal error has been largely removed by Hamon's calculation. That leaves the meteorological error. This is potentially quite large because strong westerly winds in southeastern Tasmania cause a `pile up' of the tides and result in very high tides all along the east and south coasts, including Port Arthur. In addition, every millibar of pressure above or below the mean pressure of 1014.8 mb [5] results in a raising or lowering of sea level by about 1 cm. That imposes a huge uncertainty on any spot measurement since it could make the sea level as much as 10 cm higher or lower than normal. It certainly did so on the day I photographed it. On this issue, Hamon regrets to inform us - "We cannot apply a correction for atmospheric pressure in this case, as no Hobart data for for 1888 are available." That lack of atmospheric pressure and wind data means that the Shortt observation would need a wide error bar after all. During a recent discussion group emailing over a period of a week, after receipt of their paper and attendance at their lecture, I asked one of the authors what the basis was for the long error bar applied to the Shortt/Hamon measurement for 1888, as the paper itself was somewhat vague on the point. The reply - "After adjusting for the tides, you are still left with the meteorological variability, which is simply caused by the effects of the weather (e.g. winds and atmospheric pressure) on the oceans." [pers. comm.] I took this to mean that the big unknown that Hamon acknowledged, atmospheric pressure, formed the basis for the large error bar applied to the Shortt/Hamon observation, its size making it possible for the sea level timeline in their graphic (fig.8) to squeeze in through the extreme lower tip of the Shortt error bar. Although Hamon did not have those atmospheric pressure or wind figures, they were on public record. Once I concluded from the email discussion that pressure and wind uncertainty was the primary reason for the long 1888 error bar used by Pugh et al., it took me about half an hour at the public library to find the relevant data on pressure and wind in 1888. On 24th February 1888, the atmospheric pressure at Hobart was 29.96 inches, which converts to 1014.7 millibars. The wind was light south-easterly [10]. This information was contained in the `Shipping News' of one of the local papers of the time, the Daily Telegraph. Pugh et als. determination of such a large error bar for the Shortt measurement suggests they were including meteorological uncertainty as a key factor in their calculation of that error bar, an uncertainty which now no longer exists. Now that we have the wind and pressure data, that particular uncertainty is redundant. Since Hamon estimated modern mean pressure in the region to be 1014.8 millibars, the lack of wind and the Hobart pressure for that day, 1014.7 mb, means that no adjustment is necessary. The figure of 34 cm can stand without any significant correction or uncertainty allowance for wind or pressure. A light south-easterly wind on 28th February would have minimal effect on the height of the tide that day. The pressure of that day, 1014.7 mb, is only 0.1 mb different to the modern mean pressure for that area reported by Hamon. Consequently, the sea levels measured in 1888 and in 1985 by Hamon are directly comparable since the two atmospheric pressures were practically the same. Clearly, an error bar 26 cm long on the Shortt measurement, fully one third of the tidal range, is at odds with observation now that both tides, pressure, and wind have been accounted for. Only a smaller error bar to cover observer error and other minor variables can be entertained. Hamon suggests ±5 cm for such spot observations when done carefully, and that is the revised error bar we should now apply -
The 1888 El Niño There is one further issue with the Shortt observation of 1888. In that year, a full El Niño was in progress, a particularly severe one causing widespread drought and bushfires throughout Tasmania, and widely reported in the papers of the time. The key measure of El Niño, the Southern Oscillation Index (SOI) averaged below -10 for 1888, a particularly strong event [20]. This has consequences for the Shortt measurement.
This means, the length of the Shortt error bar should not only be shortened to ±5 cm as shown earlier, but also be shifted upwards in fig.10 by an amount sufficient to compensate for the El Niño and associated lowered sea level. One of the authors said this in a subsequent email discussion on this particular issue - [pers.comm.]] "From a comparison of Spring Bay sea level data and SOI, I find that sea level varies approximately That's a 2 centimetre error factor which should have been integrated into the Shortt error bar. I checked the Spring Bay data from PSMSL for myself. Instead of using a SOI-based procedure as quoted above, I averaged the whole data from 1987 to 2000, then subtracted from it the average of the months of the 1997-98 El Niño. Sure enough, the answer also came to 2 cm. even though my method was different. Since the SOI is a statistical index based on comparative air pressure between Darwin and Tahiti, I did not regard it's use as a constant in local sea level determination to be particularly appropriate, as subtracting averages of sea levels directly made much better sense. Besides, using the pressure-based SOI as part of a sea level calculation creates an `apples and oranges' effect which may look mathematically elegant, but in reality be somewhat meaningless. That we came to the same answer for Spring Bay is interesting, perhaps coincidental, but would not necessarily agree for other stations. However, both Hamon and Pugh et al. have consistently used Hobart as their frame of reference for Port Arthur, particularly as both harbours face south, whereas Spring Bay faces east and more easily subject to wind and coastal effects on the tides. Performing the same subtraction of averages on the Hobart data yielded an El Niño sea level effect of 5 cm, not 2 cm. The statement at the lecture - "We know that sea level can't change very much between Hobart and Port Arthur. Single calculations show that it only varies at most 1 or 2 centimetres." means that any El Niño effects at Hobart will show up with a similar magnitude at Port Arthur. It is this 5 cm correction which should therefore be applied to the Shortt measurement of 1888, not the 2 cm one would get from Spring Bay. The chart now looks like this -
At this point, the `sea level rising' scenario offered by Pugh et al. is in deep difficulty. With a narrower error bar for Shortt, and its upward shifting to account for the El Niño of 1888, the bulk of their sea level rise of 13 cm has to now be accomplished between the years 1841 and 1888, a period where the authors themselves acknowledged in the lecture saw no general sea level rise at all anywhere else in the world. The Shortt measurement is now scarcely different to the current position of the benchmark. The idea that a steep sea level rise took place between 1890 and 2000 is simply not credible. In addition, land uplift of about 2½ cm since 1888 would make the centre of the Shortt measurement exactly matching the current height of the benchmark, representing no sea level change at all since 1888.
Can we See Sea Level Rise?
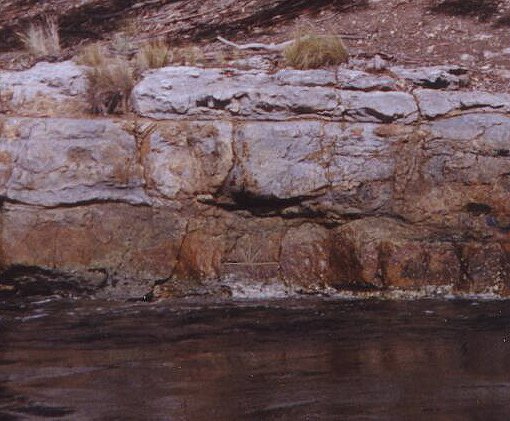
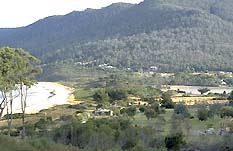
Lempriere's own tide data from 1841 and 1842 shows that the lowest tides of all were about 2 ft in his tide gauge, meaning, that the minimum depth of water was 2 ft if the tide gauge stilling well was sitting on the sea bottom. If, as is more likely, he had left a clearance of water below the well to avoid interior silting, that minimum depth would be 3 ft or more. Pugh et al. believe Lempriere kept his tide gauge at the Basin next to the stores (see map fig.4). But on a visit there during low tide, I found the depth of water in the now derelict basin to be only ankle deep (see photo). Of course it could be silt accumulation even though much of the sea bottom was stony, with not much water movement around the cove, but it hardly inspires confidence in the `sea level rising' claims, and we could find ourselves making endless excuses for each and every example where sea level rise fails to manifest itself visually. Old paintings and sketches present the same problem. Water, water, everywhere during the 19th century, but less water today. With sea level rise, the opposite should be true. For copyright reasons, these images cannot be displayed here, but
clicking the following links will bring up these images directly from
the State Library of Tasmania website. 1886
1888
1884
Eaglehawk Neck 1886
1854
1860
1844
1873
1875
1846 Here's how the Basin area looks today at low tide. High tide would only be about 75 cm above what is shown here, or 2½ feet.
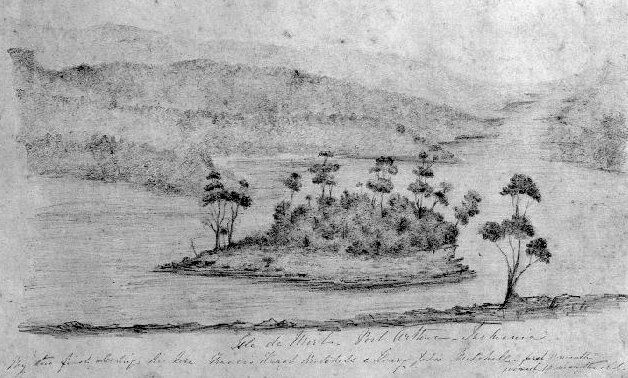
Photographs, images and paintings cannot always tell the full story, but the lack of any visible sign of sea level rise is a serious problem for the Pugh et al. claims. The `Lawn' area in the above photo was actually covered by water during the early 19th century, but it was slowly reclaimed over a period of decades. One man buried on the Isle of the Dead actually drowned where that lawn now sits. The Lawn area was not reclaimed because of any shortage of land - there's land in abundance all over the area, and the lawn was never built on or put to any productive use. For these reasons, it's not clear why the authorities even bothered. Perhaps it began to smell as the water got too shallow and stagnant over time. Here's one further visual image - the Isle of the Dead painted in the 1840s by Catherine Augusta Mitchell, wife of the superintendent of the Point Puer boys prison [13]. Compare it to the photo I took of the isle from the same angle in fig.5. Was artistic licence involved here? The words at the bottom of the painting say - "Isle de
Morts, Port Arthur - Tasmania. My two first darlings lie here.
This was less a piece of fanciful art, more a tragic memorial on canvas, in a time before photographs.
From the foregoing, the Pugh et al. study is faced with this problem. Should the sea level trend line in fig.16 be the red one, or the purple one? The purple one is that suggested by the authors at the lecture, but is clearly untenable given that we cannot now justify the excessively long 1888 error bar. Even with the original error bar, it only then barely squeezed in using the upper extreme of 1841 and the lower extreme of 1888. The red sea level trend line is physically impossible. There was slight global cooling going on during the 1841-1910 period, and that would if anything cause a sea level fall of about 3 cm, not a rise. In addition, the land itself is measured by them to be uplifting very slowly - 3.2 cm over the full 160 years. That means their sea level rise would have been swimming uphill against global cooling and rising land, a physical impossibility given the climatic circumstances and the available evidence. Probability statistics may attempt to explain it away, but cannot explain it.
Since a sea level rise of that magnitude during the 19th century is simply not credible, particularly as it was cooling during much of that time as shown in the above graph [14], we must go back further in time to question the validity of the authors' original placement of the benchmark in 1841. In the 20th century, while the IPCC claims a sea level rise of 10-20 cm globally, that has not occurred around the Australian coast. According to the National Tidal Facility (NTF) in Adelaide [15], a survey of 27 long-term tide gauges around the Australian coast (which faces three oceans) found a rate of sea level rise of only +0.3 mm/yr, equivalent to a rise over a century of just 3 cm, not 10-20 cm. Even that 3 cm is queried by them because two of the tide gauges they surveyed were on subsiding land in Adelaide harbour, with no such subsidence at nearby sites. If those two tide gauges are excluded from the sample, we end up with a sea level rise of only +0.16 mm/yr, equivalent to 1.6 cm for a full century. Whether 3 cm or 1.6 cm, the sea level trend suggested in this report for Post Arthur after 1888 is consistent with the results of the NTF survey but not consistent with the conclusions of Pugh et al. In their paper Pugh et al. drew particular attention to the 90-year tide gauge record from Fremantle in Western Australia, with a sea level rise rate of +1.38 mm/yr, equivalent to 13.8 cm in a century. That, they felt, vindicated their figures. On further investigation, it seems Perth (adjacent to Fremantle, both being one big urban sprawl) is subsiding as indicated by altimetry satellites. Other tide gauges around the Western Australian coast do not support the Fremantle picture at all. Here are the NTF figures in mm/yr, sea level rises indicated with +, falls indicated with - Wyndham -0.59,
Port Hedland -1.32, Carnarvon +0.24,
Geraldton -0.95, The average for all of them, including the errant Fremantle, is a sea level fall of -0.31 mm/yr. In other words, the comparison with Fremantle was a red herring. Comparison was also made with Fort Denison in Sydney, where a sea level rise of +0.86 mm/yr is indicated by the NTF. However, the record for that location kept with the PSMSL [18] shows the sea level rise there occurred almost entirely in the first half of the 20th century, with little change since. Again another red herring. (For more background on the Fort Denison record, see the Appendix here). The only proper basis for comparison is the average of the whole Australian coast, not selected locations, and that Australia-wide average, excluding sinking Adelaide, is +0.16 mm/yr, or 1.6 cm for the century. This is closely in line with what we see between Shortt's measurement of 1888 and the sea level at Port Arthur today.
|
The Big Day, 1st July,
1841
"The fixing of solid and well secured marks for the purpose of showing the mean level of the ocean at a given epoch, was suggested by Baron von Humboldt, in a letter to Lord Minto, subsequent to the sailing of the expedition, and of which I did not receive any account until our return from the Antarctic seas, which is the reason of my not having established a similar mark on the rocks of Kerguelen Island, or some part of the shores of Victoria Land. ..." (in the Antarctic-JD) But all was not lost. His friend, Governor Sir John Franklin, informed him that an official of the convict colony at Port Arthur, Thomas Lempriere, had been keeping tide measurements for some time and that perhaps that would afford a means of placing a sea level benchmark at Port Arthur. Ross seized the opportunity and went to Port Arthur, with the Governor, in May 1841 to meet Thomas Lempriere - [17] "My principal object in
visiting Port Arthur was to afford a comparison of our standard
barometer with that which had been employed for several years by Mr.
Lempriere, the Deputy Assistant Commissary General, in accordance
with my instructions, and also to establish a permanent mark at
the zero point, or general mean level of the sea as
determined by the tidal observations which Mr. Lempriere had conducted
with perseverance and exactness for some time: by which means any
secular variation in the relative level of the land and sea, which is
known to occur on some coasts, might at any future period be detected,
and its amount determined. The point chosen for this purpose was the
perpendicular cliff of the small islet off Point Puer, which, being
near to the tide register, rendered the operation more simple and
exact; the Governor, whom I had accompanied on an official visit
to the settlement, gave directions to afford Mr. Lempriere every
assistance of labourers he required, to have the mark cut deeply in the
rock in the exact spot which his tidal observations indicated as the
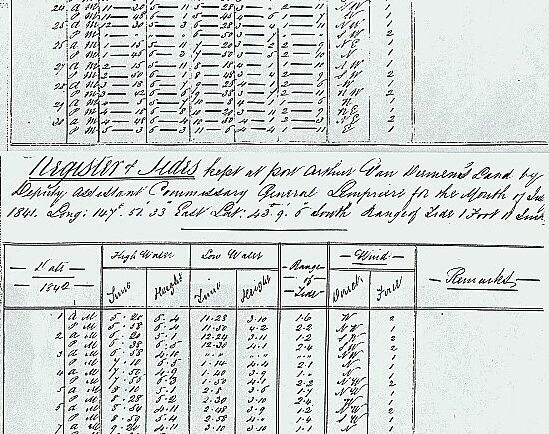
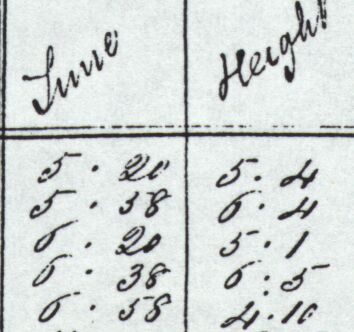
mean level of the ocean." With such an explicit explanation of what the benchmark was for, and where it was placed, it becomes perplexing that Pugh et al. did not take this testimony seriously enough to exhaust every possible avenue by which their study could avoid contradicting this very clear account. But contradict it they did - they took the view that the benchmark did not end up at `zero point' at all, but at a height closer to high tide. They justified this view by citing what Ross himself said a little later in his narrative. Speaking of any future such sea level mark, he said - "I may here observe, that it is not essential that the mark be made exactly at the mean level of the ocean, indeed it is more desirable that it should be rather above the reach of the highest tide: it is, however, important that it be made on some part of a solid cliff, not liable to rapid disintegration, and the exact distance above the mean level (which may also be marked more slightly) recorded on a plate of copper, well protected from the weather..." He added - "The most desirable position for such another mark would be near the north-west extremity of the island, and in the vicinity of Cape Grim...". (Cape Grim is at the north-western tip of Tasmania - JD). What Ross was referring to here was not the mark on the Isle of the Dead - he wrote about that in the past tense, as something already done, `rendered' - but rather about prospective future marks. These passages can in no way be interpreted as modifying or negating what he wrote earlier about the Isle of the Dead benchmark. To impute such a meaning to it is quite misleading. Besides, the benchmark was not even struck `above the reach of the highest tide', but rather at some point below high tide and fully exposed to the sea. Ross did eventually get an opportunity to strike a second mark, this time in the Falkland Islands, and he did exactly what he said above - struck it over 5 feet above mean sea level, `above the reach of the highest tide', with a plaque to indicate the exact height of the mark above the real mean sea level. That particular mark in the Falklands now poses a puzzle of its own - it shows no sea level rise. Pugh et al. deny the accuracy of the Ross testimony. Are they saying Ross was mistaken? A liar? Did Lempriere do something contrary to what Ross and the Governor ordered? It should take compelling evidence to contradict such a clear and precise testimony by someone with the stature of James Clark Ross.. But, let us assume Pugh et al. were right and that the benchmark was not struck where Ross said it was. That would mean that (a) Ross was a liar, or (b) Lempriere did the job alone and struck the mark in a different place, or in a different way, to what Ross instructed, or (c) Ross had a lapse of memory about it all and misreported the whole episode in his book. Taking each in turn, Scenario (a) is a non-starter. Ross was a respected officer of the Royal Navy, and a scientist and explorer. The Ross Sea in Antarctica is named after him. He knew only too well the importance of exactness when it came to scientific endeavours. He was also a mariner, and seafarers have their own set of ethics, one of which is to report navigation information accurately - lives may depend on it. Scenario (b) is possible, but only if Ross was not present at the time the benchmark was struck. Had Ross been supervising the operation personally, or just overseeing it, he would not have reported the mark as being at mean sea level. In addition, Thomas Lempriere had a wife and 11 children in cramped quarters at Port Arthur. He was desperately seeking both promotion and better accommodations for his large family, and it is therefore unthinkable that he would perform his task in any way other than to follow the instructions of Ross - and indeed the Governor - to the letter. Scenario (c) is not credible either. Ross was only 41 years old when he met Lempriere, and his book was published only 6 years later, making age-related memory loss very unlikely for such an important project by a man in his prime. His sense of seafarer's ethics would also have persuaded him to report the positioning benchmark with proper attention to accuracy as other seafarers might come across the benchmark sometime in the future.. Of the three scenarios, only (b) (i.e. Lempriere acting in defiance of instructions) could possibly explain the benchmark being struck at a height different to that reported by Ross. This then raises the question - was Ross present at Port Arthur on the day? If he was present, then there is no way the benchmark would have been stuck at near high tide - and then for Ross to misreport it in his book. If he was present, then we can be confident the mark really was struck at what Ross and/or Lempriere estimated MSL to be. We have no confirmed evidence that Ross was present on the day. What we do have is four items of circumstantial evidence - 1) A cruising yachtsman visited the Isle of the Dead in 1891 [4] and saw the benchmark there. He also saw something else - a small stone tablet mounted above the benchmark, "...erected it is said by Captain Ross, of the Erebus and Terror Antarctic expedition, during the interval between the visits to the south polar regions." We will return to that stone tablet later, but since 1841 was within the living memory of many of the local people of 1891, their collective memory that Ross struck the benchmark suggests he was present on the day. Ross was not the kind of man people would forget easily. He was very famous. 2) Ross was positively placed at Hobart on 29th June, 1841 (when he was engaged in compass calibration) and also on 6th July (when he hosted a farewell soiree for his friends on the eve of his departure from Tasmania) [3], so there was nothing to prevent Ross making a brief overnight visit to Port Arthur to oversee the striking of the benchmark. Had Lempriere deviated from the original plan in Ross' absence, he had sufficient time and means to send a message to Ross to that effect, either by the very quick semaphore signalling system which linked Hobart and Port Arthur, or by sending a letter by sea, or even by meeting Ross' ships (the Erebus and Terror) as they passed the harbour mouth of Port Arthur a week later on their way to Sydney. Since Ross published his account six years later in 1847, there was even ample time for normal mail. 3) Pugh et al. stated this in their paper - "Ross may have been present, although preparations for the departure of his expedition from Hobart on 7 July would have also demanded his attention. Examination of the copy of the official letter-book (now in the Scott Polar Research Institute, Cambridge; called `Ross Family Papers' in Ross, 1982) show that no official letters were signed by Ross around 1 July." Since the ships were due for departure from Hobart within a week, the lack of signed letters around that day suggests Ross was out of town. Where? At Port Arthur? Port Arthur was the only matter important enough to pull him away from Hobart during that final week of his visit to Tasmania. (4) Lempriere kept a meticulous tide log. He never missed a single tide come rain or hail or storm over the 2-year period covered by his tide log from January 1841 to December 1842. (This fact alone suggests he was a meticulous man who would not capriciously put the benchmark somewhere other than where the Governor and Ross told him to put it.) But something strange happened on 1st July. Here is how his log looks both before 1st July and after.
Look at the sudden change of the formatting. The upper part for June 1841 shows long dashes between numerals, making it possible for someone to confuse what number refers to what. Suddenly, as of 1st July, the formatting changes from a long dash to a mere dot, much clearer and less prone to reading error. Who advised him to make that change? The upper formatting was present on all pre-July logs, while the lower formatting style was present on all subsequent logs. The abruptness of the change suggests someone asked him to do it for clarity's sake, and did so on 1st July 1841. That someone could only be Ross as there was no-one of seniority in Port Arthur who was interested enough in Lempriere's tide log to suggest or demand such a change. Lempriere is even on record as wanting to please the scientific community as much as possible and a `suggestion' by such a luminary as Ross would be all the excuse Lempriere would need to change the formatting style of his tide log. Individually, all these are merely circumstantial. But collectively, they strongly suggest Ross was present on the day, and that makes his narrative all the more compelling. Ross sailed away from Hobart on his ships Erebus and Terror on 7th July 1841, the benchmark already struck, with or without his presence on that July day in 1841.
|
| The `Curious Little
Stone'
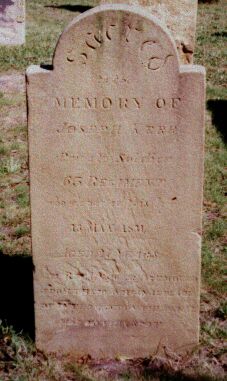
The mystery does not end there. The striking of the benchmark left an intriguing postscript, one which set the Pugh et al. team off in one direction - and this author off in another. Someone, probably Lempriere, had a small stone tablet mounted near the benchmark to explain its purpose. The Isle of the Dead had numerous gravestones, but this one was quite different as it sought to explain what the benchmark was all about. The tablet went missing early in the 20th century so we have no way to confirm today what was written on it. But we do have the testimony of two people who transcribed its words. The first was our Mr. Mason who not only measured the height of the benchmark in 1888, but also told Cmdr. Shortt what was written on it. Here's what he transcribed -
"On the rock
fronting this stone a line denoting the height of the tide now struck on
the 1st July, But, three years later in 1891, we have this account by the visiting cruising yachtsman who sketched and accurately transcribed the words from the gravestone of one Joseph Kerr. Then he noticed - "A few yards away, on the rocks fringing the shore and facing the east, was a curious little stone, erected it is said, by Captain Ross, of the `Erebus' and `Terror' Antarctic expedition, during the interval between the visits to the south polar regions. It bears the following inscription:- "On the rock fronting this stone a line, denoting the height of the tide, was struck on the 1st July, 1841. Mean time, 2.44 p.m. Moon's age, 12 days. Height of water in the tide gauge, 6 ft 1 in." [3] The two accounts differ from each other in the text coloured bold brown. We have a clear conflict over the time of the striking of the benchmark (2.44 p.m. versus 4.44 p.m.), and a grammatical difference - `now struck' versus `was struck'. But there are subtler differences. Notice the formatting of the times, Mason's clumsy `4h. 44m. p.m.' versus the yachtsman's simpler `2.44 p.m.' Now look at fig.19 above at Lempriere's log entries. Lempriere uses the exact same formatting style for times (post-1st July) as the yachtsman used, but not Mr. Mason. There are subtler differences still, such as the yachtsman's use of capital letters at the start of sentences, and the yachtsman's inclusion of commas.
Looking to Mason's version above, we see the phrase `now struck' underlined, as per Shortt's qualifier, but there were no figures underlined as Shortt claimed. We are therefore left to ponder exactly which figure or set of figures were problematic. The time? The tide height? The yachtsman gave no indication of having any problem with reading the words on the tablet, so we are left with something of a puzzle here. Which time is the right one? Which tide height applies? Taking them in turn, the time of 4.44 p.m. reported by Mason is almost consistent with a height of 6ft 1in in Lempriere's tide gauge, based on the data in his log, but 2.44 p.m. definitely is not. However, 4.44 p.m. (4.55 p.m. modern Australian Eastern Standard Time) is a very strange time of day to be doing important survey work - close to the winter solstice of the southern hemisphere, virtually at twilight, and close to high tide when striking a benchmark would be both difficult and potentially dangerous due to the depth and turbulence of water at the cliff face. On the other hand, the yachtsman's 2.44 p.m. in mid afternoon makes much better sense as there was good light and a lower tide.
Pugh et al. did address some of these problematic issues in their paper and recent lecture including the Ross narrative. However, at a previous lecture on 5th April 2000 given to the Royal Society of Tasmania by the same authors, they did not mention the Ross narrative or the yachtsman's reading at all. On that occasion, they simply reported on Mr. Mason's 1888 reading and proceeded from there. The mostly scientific audience remained unaware that additional significant evidence existed, evidence which did not favour the scenario of sea level rise being presented. In the end, I raised the issue of the Ross narrative and the yachtsman during question time. |
|
References Primary References for this Report - [1] Pugh, D.,
Hunter, J., Coleman, R., Watson, C., (2002) "A Comparison of
Historical and Recent sea Level [2] Pugh D., & Hunter, J.,
"Sea Level in Tasmania from 1841 to
the Present: The Results of the Port Arthur Study", [3]
Ross, Sir J.C., (1847), "A Voyage of
Discovery and Research in the Southern and Antarctic Regions, During
Additional Key References [4] `Eight Bells' (1892), The Australasian, "Notes of a Yachting Trip", 6th Feb., p.281 [5] Hamon, B. (1985) "Early Mean Sea Levels and Tides in Tasmania", Search, vol.16, No.9-12, Oct/Dec, pp.274-277 [6] Lempriere, T. (1841-1842) "Register of Tides Kept at Port Arthur", from the Royal Society archives, London [7] Shortt,
Cmdr. J., (1889), "Notes on the
Possible Oscillation of Levels of Land and Sea in Tasmania During [8] Shortt,
Cmdr. J., (1885), "Summary
of Observations on Earthquake Phenomena Made in Tasmania During 1883
Other References [9] Biggs, A.,
(1885), "The Tasmanian
Earth Tremors 1883-4-5", Royal
Society of Tasmania papers, [10] The Daily Telegraph newspaper, "Shipping News", State Library of Tasmania, Launceston, 25 Feb 1888 [11] Evans G., & Ross, M. "A Visitors Short History Guide to Port Arthur", Regal Publications, Tasmania, 1995 [12] Lands Department, Tasmanian Government, Hobart, Personal communication, 28 Jan 2003 [13] Lord, R., "The Isle of the Dead, Port Arthur", Richard Lord & Partners, Hobart, 1995 [14] NASA Goddard Institute, Online Weather Station Records [15] Mitchell, B., et al., "Australian Mean Sea Level Survey", National Tidal Facility, Adelaide. Online Copy [16] `Hobart Town Advertiser' newspaper, editions from 27th April to 9th July 1841, shipping column. [17] `The Courier' newspaper, (1841), May 21. Launceston Reference Library archives, Tasmania [18] The Permanent Service for Mean Sea Level, Online Tide Gauge Data [19] Weidenhofer, M., (1981), "Port Arthur: A Place of Misery", Oxford University Press, Melbourne, p.29 [20 Climatic Research Unit - SOI Online Data |
![]()
Fort Denison, Sydney Harbour, Australia
|
Fort Denison which lies in the outer Sydney Harbour, New South Wales, Australia. Mean Sea Level is presented. The graph below shows monthly sea level since 1914 smoothed with a 12-monthly running mean to reduce monthly `noise'. Fort Denison with 82 years of data shows a sea level rise of +0.86 mm/yr (or 8.6 cm if taken over a full century). Data from the Permanent Service for Mean Sea Level. In a recent paper on the Isle of the Dead sea level benchmark at Port Arthur, Tasmania, struck in 1841 by Ross and Lempriere, Hunter et al (GRL, v.30, No. 7, 1401, April 2003) claimed that sea level had risen there by around 1 mm per year (or 10 cm over a full century), citing a comparison with Fort Denison and Fremantle in Western Australia as cross validation for their statistical study. According to Australia's National Tidal Facility, Fort Denison is only one of three tide gauges around the Australian coast to have more than 60 years of historic sea level data. The other two are Port Pirie in South Australia and Fremantle in Western Australia. Fremantle is the oldest (90 years), but because recent satellite measurements have shown Perth (near Fremantle) to be subsiding steadily, its 90-year tide gauge record cannot be used in sea level studies because the land subsidence creates an artificial sea level `rise'. Other tide gauges on the same coast as Fremantle show an average sea level fall over the last 30 years , further invalidating the Fremantle record. Here are the NTF figures in mm/yr, sea level rises indicated in red, sea level falls in blue -
Wyndham -0.59,
Port Hedland -1.32,
Carnarvon +0.24,
Geraldton -0.95, The average for all of them, including the errant Fremantle, is a sea level fall of -0.31 mm/yr. With Fremantle clearly invalid, that leaves only Fort Denison and Port Pirie of the three 60-year plus stations. On the face of it, Fort Denison's sea level rise would seem to support Hunter et al. But does it? A careful look at the plot of Fort Denison below shows that most of the sea level rise there took place in a 3-year period between 1948 and 1951 when an apparent stepwise rise in long-term sea level, of about 6 centimetres, occurred. This is impossible physically. Sea level cannot simply rise 6 cm in three years from one long-term level to another higher level. It is also unlikely to be caused by land subsidence as that too is a slow cumulative process as happens at Fremantle, not a sudden step action. Earthquakes or tremors could cause it - if severe or numerous enough - (such as the 1,000 tremors which happened in eastern Tasmania during the early 1880s, and which may have affected sea level at the Isle of the Dead during that period.). But that seems very unlikely in the case of Sydney Harbour. That leaves instrumentation problems as the only viable explanation for the sudden datum shift around 1948-51. Such datum shifts caused by instrument problems are very common with tide gauges, such as those of Hobart shown here. Simple fouling by sea weed, marine growths and debris is all it takes to skew readings from a tide gauge. Relocation or instrument replacement can also cause such shifts.
But suppose Hunter et al. was right and that the Fort Denison datum shift was a genuine sea level rise and not an artifact of instrument problems. Such a large sea level rise could not go un-noticed at the other long-term tide gauge in Australia - Port Pirie in South Australia
|
Return to "Still Waiting For Greenhouse"
