Tasmanian Sea Levels:
The `Isle of the Dead' Revisited
by John L. Daly
Part 2
9th February 2003
It is assumed that the reader has already read Part 1.
If that is not the case, Part 1 is here
![]()
| Reviewing the Ross
Narrative
In Part 1, several quotes were taken from the Ross narrative, and in the minds of some, this might lead to the perception that perhaps quotes were being taken out of context. This could be done quite unconsciously either by myself, or by Pugh et al. [2, 3] To avoid that possibility, presented below is the full unabridged
text of the Ross narrative as it relates to the benchmark issue [3].
All preceding and subsequent text to what is shown below related to
other matters connected with his voyage. The
long opening paragraph is exactly how Ross wrote it as I have avoided
even breaking it up into smaller paragraphs for ease of reading in case this might also
result in perceived subtle changes in meaning or emphasis. The
explanatory notes on the left column are mine. |
| note references to `mean level of the sea' and `zero
point'
Note the use of the term `tide register' instead of `tide gauge' The only islet off Point Puer is the `Isle of the Dead' The `Derwent' is the estuary in which Hobart sits, just west of Port Arthur `opposite side of the island' refers to Tasmania itself. note the requirement for a `long series of observations' note the need for any new marks to be `above the reach of the highest tide'
Van Diemen's Land is the former name for Tasmania Kerguelen is a large island in the Southern Ocean. `Victoria Land' is in the Antarctic.
The book was published only 6 years later. |
"My principal object in
visiting Port Arthur was to afford a comparison of our standard
barometer with that which had been employed for several years by Mr.
Lempriere, the Deputy Assistant Commissary General, in accordance
with my instructions, and also to establish a permanent mark at
the zero point, or general mean level of the sea as
determined by the tidal observations which Mr. Lempriere had conducted
with perseverance and exactness for some time: by which means any
secular variation in the relative level of the land and sea, which is
known to occur on some coasts, might at any future period be detected,
and its amount determined. The point chosen for this purpose was the
perpendicular cliff of the small islet off Point Puer, which, being
near to the tide register, rendered the operation more simple and
exact; the Governor, whom I had accompanied on an official visit
to the settlement, gave directions to afford Mr. Lempriere every
assistance of labourers he required, to have the mark cut deeply in the
rock in the exact spot which his tidal observations indicated as the
mean level of the ocean. The tides
in the Derwent were too irregular, being influenced greatly by the prevalence
of winds outside and the freshes from the interior, so that we could not
ascertain with the required degree of exactness the point of mean level.
It would have been desirable to have fixed a similar mark on some part
of the opposite side of the island, but a prolonged series of
preliminary observations of the tides are necessary, and as these had
not been obtained, and our limited stay, as well as the full employment
for all our observers, which the necessary experiments with the
magnetometers provided, did not admit of our doing it. I can only
hope that some individual with like zeal for science with Mr. Lempriere,
and with time at his disposal, may yet accomplish this desideratum.
I may here observe,
that it is not essential that the mark be made exactly at the mean level
of the ocean, indeed it is more desirable that it should be rather above
the reach of the highest tide: it is, however, important that it be made
on some part of a solid cliff, not liable to rapid disintegration, and
the exact distance above the mean level (which may also be marked more
slightly) recorded on a plate of copper, well protected from the
weather, by placing a flat stone with cement between, upon the plane
surface or platform which should constitute the mark from which the
level of the mean tide should be measured.
The most desirable position for such another mark would be near the north-west extremity of the island, and in the vicinity of Cape Grim, near which the Van Diemen's Land Company has a small establishment. The fixing of solid and well secured marks for the purpose of showing the mean level of the ocean at a given epoch, was suggested by Baron von Humboldt, in a letter to Lord Minto, subsequent to the sailing of the expedition, and of which I did not receive any account until our return from the Antarctic seas, which is the reason of my not having established a similar mark on the rocks of Kerguelen Island, or some part of the shores of Victoria Land. Upon this subject that great philosopher observes that "if similar measures had been taken in Cook and Bougainville's earliest voyages, we should now be in possession of the necessary data for determining whether secular variation in the relative level of land and sea is a general or merely a local phenomenon, and whether any law is discoverable in the direction of the points which rise or sink simultaneously." from - Ross, Sir J.C., (1847), "A Voyage of Discovery and Research in the Southern and Antarctic Regions, During the Years 1839-43", John Murray, London, pp.22-24. |
Pugh et al. base this rejection on two grounds - the height of water in Lempriere's tide gauge
(6ft 1in), as given by both witnesses who read the now-lost `curious little stone' and,
the time given by one of them, 4.44 p.m. in Mr. Mason's version [4, 7].
That for them was enough to negate the Ross narrative both as to the
height struck and the method by which it was struck, even though
Mason reported the stone and the writing on it as being damaged. Instead they
believe Lempriere acted alone, and contrary to what Ross said. But the
above narrative shows that to be a risky option for Lempriere - "the Governor, whom I had accompanied on an official visit
to the settlement, gave directions to afford Mr. Lempriere every
assistance of labourers he required, to have the mark cut deeply in the
rock in the exact spot which his tidal observations indicated as the
mean level of the ocean." An
order from your colonial Governor in the context of the British Empire
of Victorian days is not something to be flouted lightly, and definitely
not in a convict colony like Port Arthur where the authorities already had suitable
accommodation for recalcitrants.
But that cannot be done from two locations 1.2 km apart, using 19th
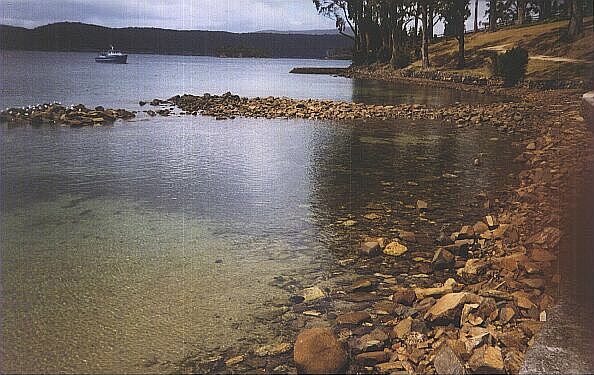
century technology. 6) The `hit it and see' approach may also be preferred by Pugh et al. because Lempriere had no way to instantly level out a tide gauge height (located 1.2 km away at the Basin according to Pugh et al.) against a height mark cut on the cliff. This is because there is no direct line-of-sight between the two locations. Besides, 19th century technology would not be capable of levelling heights accurate enough for a benchmark over that distance on a single reading prompted by a gunshot. Here again Pugh et al. are ignoring the Ross narrative. Ross said - "The point chosen for this purpose was the perpendicular cliff of the small islet off Point Puer, which, being near to the tide register, rendered the operation more simple and exact.". (Note the word `rendered', in the past tense, hinting that Ross was a witness to what he wrote about.) What exactly did Ross mean by a `tide register'? And how near is `near'. At one time, it was speculated that perhaps the tide gauge itself was located on the Isle of the Dead. However, once the Lempriere tide log was obtained, it became clear that this was simply not possible as the log was too complete. Over a 2-year period, not a single entry was missed, come rain, or hail, or storm. That could only mean that the tide gauge was located somewhere at the convict settlement, not on the Isle. In retrospect, all we had to do was read what Ross actually said, not what we think he said. He referred, not to a `tide gauge', but to a `tide register', not necessarily the same thing at all. Lempriere often referred to a `tide gauge' in his earlier diaries (unfortunately, we lack any diary from him to cover 1841), and `tide gauge' was a common term at that time. So why did Ross choose to refer to a tide `register' instead of the more common tide `gauge'? At many ports in the world, we find flat wooden planks attached to docks and wharves with sea level height marks on them to guide ships entering and leaving the area. Such tide height markers are often height-referenced to tide gauges located somewhere in nearby. It is most probable that this is the `tide register' that Ross was referring to - a tall plank of wood mounted close to the present benchmark site with tide heights painted on it in feet and inches, those marks height-referenced to Lempriere's tide gauge at the convict settlement. The `tide register' could be very accurate as correct levelling to match the tide gauge to the `register' could have been done carefully over a period of time. Indeed, it was probably already there when Ross visited in May 1841 as a guide to incoming ships as to depth of water at the cove. Since it was very shallow in the cove, that kind of information to ships as they passed the north side of the Isle of the Dead would be invaluable for a captain when deciding where to drop anchor. This is a common practice in most ports of the world even for ships today. As for levelling the `register' against the tide gauge, 1.2 km may seem too far away given that only early 19th century instruments were available, plus the lack of a direct line-of-sight between the benchmark and the Basin. It has already been shown that there is today insufficient depth of water at the Basin/Stores area to account for the depth of water reported in Lempriere's tide gauge at the lowest of tides (fig.2).
However, there is another, more suitable location for the tide gauge - and that is at the dockyard site (see map, fig.1). There is sufficient depth of water there to account for the Lempriere tide data, and it is only about 900 metres from the benchmark site, with a direct line-of-sight between the two. 19th century instruments would make accurate levelling between the two locations possible when multiple measurements over a period of time are averaged together [15]. With a tide `register' located on the Isle and very close to the benchmark site, then the words: "The point chosen for this purpose was the perpendicular cliff of the small islet off Point Puer, which, being near to the tide register, rendered the operation more simple and exact." makes perfect sense. If the distance between the benchmark and the tide `register' was only a matter of metres instead of hundreds of metres, then indeed the actual mechanics of striking a benchmark to a pre-calculated height would be both `simple and exact' - just as Ross said. Without a nearby `register', there is no way the operation could have been `simple' or `exact'.
The Alternative Scenario for 1st July 1841 While the foregoing parts of this report suggest that the Pugh et al. scenario of sea level rise must be wrong, it now becomes necessary to suggest where and how the benchmark might have actually been placed in 1841, given that the Pugh et al. placement and method must be incorrect. When evidence is conflicting as is the case here, one sensible way to proceed is to establish which portion of the evidence can be taken as accurate, and then attempt to resolve any resulting conflicts with other evidence from that fixed anchor point. Pugh et al. took Mr Mason's reading of the tablet matched to Lempriere's tide log as their fixed point of reference, building their whole case from there. By contrast, the starting point for the alternative scenario has to be the Ross narrative, again in conjunction with Lempriere's tide log, if for no better reason than the clear and unambiguous statement by Ross that the benchmark was struck to the mean level, and done so by pre-calculation made from the tide log. Since Ross was a man of high scientific stature and courage, and a master mariner, we cannot dismiss his testimony as lightly as Pugh et al. appears to do. Since the mark was struck at mean level (or more precisely, what Ross estimated what was mean level) we have to then take seriously the yachtsman's reporting of what was written on the tablet [4]. He said the benchmark was struck during the afternoon at 2.44 p.m., not 4.44 p.m. as reported by Mr Mason. The yachtsman's time of 2.44 p.m. corresponds to a tide height of 5ft 1in, not the 6ft 1in. both he and Mr Mason actually reported. If we postulate that the `6' in the tide height recorded on the tablet was really a corroded `5' and therefore innocently misread by both Mr Mason and the yachtsman (for the reasons explained in Part 1), we then have a new tide height which is consistent with the yachtsman's time, 5ft 1in at 2.44 p.m. The question is - is Ross' `zero point of the sea' also consistent with a tide height of 5ft 1in? Ross wrote in his narrative - "... and also to establish a permanent mark at the zero point, or general mean level of the sea as determined by the tidal observations which Mr. Lempriere had conducted with perseverance and exactness for some time". This means that the benchmark was struck according to pre-calculation, not according to the tides of the day. This is an important point because it makes redundant any attempt to drag in tidal patterns, atmospheric pressure or wind data for 1st July 1841. Pugh et al. went to some considerable effort to reproduce the tidal patterns of the day, but it was a largely wasted exercise since Ross made it clear that previous observations decided the height of the benchmark, not the tides or weather of the day. If Ross and Lempriere had decided in advance which height the benchmark was to be struck to, then meteorological and tidal conditions on the day become quite irrelevant. Reinforcing this point are these words from Ross himself - "It would have been desirable to have fixed a similar mark on some part of the opposite side of the island (Tasmania - JD), but a prolonged series of preliminary observations of the tides are necessary, and as these had not been obtained ... did not admit of our doing it." It is clear therefore that neither Ross nor Lempriere struck that mark on the basis of tides on the day, nor did they simply strike a mark on a convenient spot on the cliff and then height reference it to the tide gauge as Pugh et al. suggest. With only pen and paper, Ross and Lempriere had a mass of confusing data to work with. Given that 18½ years is needed for a full determination of MSL at any one place, their determination of exactly where `mean sea level' was would have been a very difficult mathematical exercise to say the least - and doomed to incur a significant error. Here is what they had to work with - just 6 months of data, with MSL apparently changing during that time. |
Fig.3 -
Tides at Port Arthur, January to June 1841 [6]
| Where exactly is `mean sea level' in that time
series? Ross and Lempriere would not have had the benefit of
Microsoft Excel to help them, not even a common calculator. It was just pen and
paper for them. Depending on which time frame you chose, you could
take 4 ft 10 in as MSL, or 4 ft 7 in, or 5ft 1 in, or anything in between. Pugh
et
al. determined that real MSL at that time was 4 ft 7 in. in Lempriere's
tide gauge. But that calculation of theirs was based on data analysis using
computers and with tide data extending past 1st July 1841 to December
1842, plus the Hobart tide constants. Obviously, neither Ross nor Lempriere could have included post 1st July tidal data when calculating their `mean sea level'. That was still in the unknown future for them. Nor could they use the Hobart tide constants since they too were unknown to them at the time. So, they had only the first 6 months of 1841 to work with, plus any pre-1841 data which Lempriere might have had on hand but which is not available today. Ross even used the phrase `general mean level of the sea', implying that he himself realised he could only determine MSL in a general way, not to the exactness of millimetres that we can do today. From the first 6 months of 1841, Ross and Lempriere had several choices - they could take an average of the previous 6 months, or take an average of the previous month (June 1841), or some other period of choice. Given the monumental task of calculating 6 months of data, amounting to over 1,800 data entries to be processed by hand, they may have finally opted for an average for the month of June 1841 - 5ft 1in. This choice would be reinforced by the fact that 5ft 1in. also happened to be near the expected mean tide for 1st July 1841, providing an opportunity for them to cross check the benchmark placement. The words on the tablet hint at such a reason, with the choice of 1st July possibly being based on this coincidence between expected mean tide for that day and their calculation of MSL. |
Fig 4 - Tides at Port Arthur for June and 1st July, 1841 [4]
|
From the June tides chart in fig.4 above, we can readily see from the green lines indicating the two alternative heights that 5ft 1in is clearly at or near the average, while 6ft 1in is clearly near high tide. 6ft 1in is even above several of the high tides for that month, particularly around 11th June. Referring to fig.5 below, 5ft 1in in Lempriere's tide gauge equates to 44.5 cm (Pugh et als. height for the benchmark) minus 30.5 cm (1 foot less when the `6' is changed to `5') equals 14 cm, this being the actual height of the benchmark above the real mean sea level as it existed in 1841. In other words, the Ross-Lempriere estimate of mean sea level was not accurate, nor should we be surprised at this. The tidal pattern was very complex and they lacked the computing technology or the information that we now enjoy.
At the recent lecture [2], one of the authors mounted a `straw man' exercise, exploring the theory of the benchmark being at MSL as Ross said in his narrative. Except, the MSL they chose was the one which was derived from their analysis of the full 2-year Lempriere data (Jan 1841-Dec 1842) and the Hobart tide constants. In other words, they set their sea level right up at the zero line of the chart, not at 14 cm below as the alternative scenario would suggest. Neither Ross nor Lempriere had access to that much data, and they lacked the computing power to deal with the small 6-month sample of data they did have. Naturally, the `straw man' was easy for them to dismiss as it was based on an unrealistic assumption - that Ross could have somehow known the real MSL with none of the assets or data possessed by Pugh et al. The alternative scenario of the benchmark being struck at 5ft 1in at 2.44 p.m. does present a new problem of its own however, partly mirroring the problem that Pugh et al. have. Just as they have an unsupportable sea level rise from 1841 to 1888 to deal with, the alternative scenario has a sea level fall just as big. On the face of it, that puts both scenarios in difficulty as shown in fig.5 above. Or does it? The alternative scenario has two factors in its favour. Firstly, the world's climate over that period was cooling slightly, so that some sea level fall associated with that cooling would be expected. But that could only give sea level falls of perhaps 3 centimetres. The reclaiming of part of Mason Cove may well have been possible precisely because of that sea level fall during the latter half of the 19th century. Secondly, the survey work done by Pugh et al. established that Tasmania is ever-so-slowly rising, their estimated uplift for the 160-year period being 3.2 centimetres. based on satellite altimetry in the last few years and post-glacial rebound modelling. That would mean an additional fall in relative sea level between 1841 and 1888 of about 1 centimetre, making a total fall in relative sea level of about 4 cm. Pugh et al's. claim of sea level rise during that period goes against that background climatic and uplift trend. However, the climatic cooling and the small uplift factor does not account for the rest of the sea level fall required, about 11 centimetres (or 4½ inches) in all. This is where the 1880s earth tremors become important.
The 1880s Tremors
The question is, did it? We don't know for sure, but this comment at the end of Shortt's 1888 paper suggests it did. - "It is interesting to place on record, that Captain Miles has learnt from the half-casts in the Furneaux Group they have noticed within the last few years that there seems to be less depth of water over certain well-known rocks near the islands than formerly." A few centimetres of mean sea level fall would normally go completely un-noticed due to the large variability of the tides, and changes in level due to weather. However, since the `half-casts' of the Furneaux Group did notice it, the fall in level there must have been many centimetres, sufficient to account for a significant sea level fall `within the last few years'. How significant? It was pointed out in Part 1 that the nearly 10 cm sea level rise claimed by Pugh et al. shows no visible evidence of its presence at all, not from photographs, not from paintings or sketches, not from the width measurements of Eaglehawk Neck. Therefore, for the `half casts' to notice a sea level fall in the Furneaux Group suggests a fall greater than 10 cm. Similar tremor activity in other parts of the world cause vertical movements of the land by much larger amounts than a mere 11 cm (4½ inches). In Tasmania's case, we are talking about an uplift in the land, not in one go as happens in earthquakes, but incrementally in tiny amounts, over a period of 4 years and over a thousand tremors. Even the comparison between the width of Eaglehawk Neck at 71 metres in 1854 and 106 metres today, as reported in Part 1, further suggests a sea level fall there since 1854. The spate of earth tremors in the 1880s puts the last piece of the jigsaw into place. To explain the progress of the alternative scenario, notice that there is a background tendency for the land to uplift, estimated at 3.2 cm over the full 160 year period, meaning that there is a constant upward pressure on the land from below. This creates a downward drift on any relative sea level trend. In August 1883, Krakatau erupted, soon followed by a series of earthquakes all over the world. Since the east coast of Tasmania has a natural uplifting tendency anyway, the net effect of the local tremors could have been to incrementally raise the land, millimetre by millimetre over the period of the tremors, by an amount sufficient to be noticed by the `half-casts' of the Furneaux Group who were not equipped with measurement devices. Even before the 1880s, reports of sea level changes were already being noted by the scientific and nautical communities. In one Royal Society paper from 1855, it was reported that the sea was rising in northwestern Tasmania as evidenced by sea incursions on the low-lying coast there, while it was falling in the east of Tasmania and across Bass Strait in Victoria. In particular, the entrance to Port Phillip Bay in Victoria (leading to Melbourne) attracted this observation - "In connection with this subject, I may observe that
it is stated that reefs now exist at the entrance By the time Cmdr. Shortt made his measurement in 1888, prompted by the 1880s tremors, those tremors had subsided, leaving the benchmark higher out of the water than formerly, not by much, only 11 cm (or 4½ inches) above its likely pre-Krakatau level, but enough to vindicate Ross and his account of what he did and how he did it. Since then, there has been a small tendency to sea level rise, of about 0.16 - 0.3 mm/yr around the Australian coast [13] (equivalent to 1.6 - 3 cm in a century), but the gentle uplifting of the land in Tasmania counters that by a similar margin resulting in little apparent change in relative sea level at all at Port Arthur since 1888. (N.B. - In recent years, there have been tremors from time to
time, but not on the scale or number of the 1880s. It is interesting
to note however that there are now reports that there is a volcanic `hot
spot' of molten magma directly under the Bass Strait, straining the crust
above it - a volcano waiting to be born. A recent tremor under the
sea in Bass Strait indicated that this `hot spot' - which extends
eastwards for several hundred kilometres - is active and putting upward
pressure on the land mass of Tasmania and southern Victoria. - See
this `Geoscience Australia' statement on the subject, in which they
say -
"We have a
hotspot system of our very own. Australia's hotspot currently lies under
Victoria, As far as hotspots go,
the one in our backyard is slumbering. Present hotspot activity is For the alternative scenario to be valid, we have to accept that some vertical movement would have to happen in the wake of the 1880s tremors as reported by Shortt, and regard the 6 ft 1 in height reported by the observers of the tablet to be an innocent misreading due to a 6-5 confusion of numerals caused by erosion damage to the tablet, damage confirmed by Mr Mason in 1888 . Given these two propositions, both of which are both physically possible and contain some degree of probability, then all the other evidence fits into place with no further inconsistencies or contradictions. The integrity of the Ross narrative is maintained and comparison with pictorial evidence is consistent to the view that some sea level fall occurred during the 19th century and that very little sea level change took place after 1888. For the Pugh et al. scenario to work, the Ross narrative has to be rejected almost in its entirety, not just the height of the benchmark, but also the method by which was struck. The yachtsman's observation of the time must be rejected (even though he proved his transcription skills with one of the gravestones), and we must entertain a large sea level rise during the 19th century at a time of general cooling and against the trend of the uplift rate - and against the trend of the 1880s tremors. Not only does this involve too many problems, `what-ifs' and contradictions with evidence compared to the alternative scenario, it is also physically impossible as there could not possibly have been a large relative sea level rise 1841-1888 given all these restraints on sea level rise at that time.
Conclusion Pugh et al. reported at both at the lecture and in their paper at how well their scenario fitted the IPCC claim of 10-20 cm global sea level rise during the 20th century. However, that IPCC claim is contradicted by tide gauge data from around the Australian coast that observed sea level rise has been less than a tenth of that claimed by the IPCC [13]. Furthermore the IPCC claim is not based on any observed sea level rise as such - rather it is based on models, specifically a geophysical model to quantify the vertical movement of the continents since the end of the last ice age. Most of the observed sea level changes were based on North Atlantic data, heavily affected by `Post Glacial Rebound' (the massive rebalancing of the continents which were once weighed down by ice kilometres thick). The IPCC simply accepted that model as indicative of real sea level trends. The model they use is very poorly validated outside the North Atlantic basin and may bear little or no relation to real continental movements outside that limited region [16]. In effect, Pugh et al. are matching their Port Arthur scenario against an IPCC model, not against real observations. That is not observational validation, merely a model-based prop. The attention Pugh et al. gave to the IPCC and its claims that sea level rose during the 20th century by 10-20 cm creates the distinct impression that the IPCC global scenario was a key consideration in how their 7-year study progressed, that the IPCC claims became a central point of validation when deciding which of the several possible Port Arthur scenarios they should favour. To do this, they even raised the red herring about Fremantle, the only location in Western Australia to have a significant sea level rise trend, all the others being close to neutral or with falling sea levels. Ignored was the National Tidal Facility survey of long-term tide gauges which showed sea level rise around Australia at about a tenth of that claimed by the IPCC. It is the NTF survey that Port Arthur should really have been compared with, not with the IPCC's models. One thing which has bedevilled the Port Arthur sea level benchmark issue is the conflicting and contradictory nature of the evidence. There is no scenario possible which can accommodate all the evidence at face value. In the end, some part of it must be judged mistaken, or that some other variable outside the available evidence has intervened, such as the 1880s tremors. For Pugh et al., they judged the details given in the Ross narrative to be false, both as to the height of the benchmark and the method by which it was struck. Yet they can offer no plausible reason as to why the narrative should be so at odds with their scenario. They therefore leave us with the distinct impression that Ross must be a liar, or a fool, or suffering severe memory loss. He was none of those. For this report, it has been maintained from the very outset that whatever we deduce about the benchmark's origins, it must not be inconsistent with the Ross narrative. After all, he was the person responsible for putting it there in the first place. Since the totality of evidence itself is inconsistent, then the error (or errors) must lie elsewhere, not with the narrative itself. In other words, we must consider how the benchmark could have ended up where it is, close to today' s high tide, using an explanation that is both physically possible and for which some evidence already exists. As regards the tablet observed by Mr Mason and the yachtsman, we have Mr Mason's testimony as reported by Cmdr. Shortt - "It is stated by my informant, Mr. Mason, that the words and figures underlined are nearly obliterated, and that he has given what they appear to be." From this we can clearly see that a 6-5 confusion about the tide height is both physically possible and has some degree of probability, given the similarity in appearance of the two numerals. As regards the additional sea level fall of 11 cm which the alternative scenario calls for, that is also physically possible given the tremors at time, more than a thousand of them, for which we have documented evidence, and Cmdr. Shortt's report about sea level falls over a few years at the Furneaux Group. The recent discovery of a volcanic `hot spot' under Bass Strait only reinforces the likelihood and scale of that vertical movement. With only those two resolutions to the contradictory evidence, namely the assumption that `5' was misread as a `6', and that the tremors raised the land a mere 11 cm (4½ in.) during the early 1880s, all the rest of the evidence falls neatly into place with no further contradictions to resolve. Most importantly, the Ross narrative is then reaffirmed as the true account of what really happened. See also - Sea Level at Hobart, Tasmania In a later paper, Hunter et. al. used a reconstructed sea level history at nearby Hobart to validate their claims about sea level at Port Arthur. However, they failed to authenticate any of their claims about Hobart. Click the title for full details. |
![]()
|
References Primary References for this Report - [1] Pugh, D.,
Hunter, J., Coleman, R., Watson, C., (2002) "A Comparison of
Historical and Recent sea Level [2] Pugh D., & Hunter, J.,
"Sea Level in Tasmania from 1841 to
the Present: The Results of the Port Arthur Study", [3]
Ross, Sir J.C., (1847), "A Voyage of
Discovery and Research in the Southern and Antarctic Regions, During
Additional Key References [4] `Eight Bells' (1892), The Australasian, "Notes of a Yachting Trip", 6th Feb., p.281 [5] Hamon, B. (1985) "Early Mean Sea Levels and Tides in Tasmania", Search, vol.16, No.9-12, Oct/Dec, pp.274-277 [6] Lempriere, T. (1841-1842) "Register of Tides Kept at Port Arthur", from the Royal Society archives, London [7] Shortt,
Cmdr. J., (1889), "Notes on the
Possible Oscillation of Levels of Land and Sea in Tasmania During [8] Shortt,
Cmdr. J., (1885), "Summary
of Observations on Earthquake Phenomena Made in Tasmania During 1883
Other References [9] Biggs, A.,
(1885), "The Tasmanian
Earth Tremors 1883-4-5", Royal
Society of Tasmania papers, [10] Peltier W.
& Tushingham M. "ICE-3G:
A New Global Model of Late Pleistocene Deglaciation based upon [11] Gunn,
Ronald, (1855) "On the
Encroachments of the Sea along the North Coast of Tasmania", Royal
Society [12] NASA Goddard Institute, Online Weather Station Records [13] Mitchell, B., et al., "Australian Mean Sea Level Survey", National Tidal Facility, Adelaide. Online Copy [14] Australian Geoscience, "Tassie Quake Where Hotspot Snoozes", April 2002 [15] Negretti & Zambra, (1864), "A Treatise on Meteorological Instruments", Baros Books 1995 reprint , UK. [16] Daly, J., "Testing the Waters: A Report on Sea Levels" 2000 |
Return to "Still Waiting For Greenhouse"