The Greenhouse Delusion - Chapter 5 by Dr Vincent Gray
Sea Level
![]()
|
Climate Change 01 (1)
in its “Summary for Policymakers”
has a headline “Global average sea
level has risen.” This is followed by the statement “Tide
gauge data show that global average
sea level rose between
0.1 and 0.2 metres during the 20th century”. But how
representative are tide-gauge data? Chapter
11 - “Changes in Sea Level” (2)
has 41 pages of
speculations, estimates,
forecasts and models. Only just over three pages (3)
are devoted to “Mean Sea Level Changes over the Past 100 to 200
Years”. The
level of the sea is a highly variable quantity; affected by the
earth’s orbit, by the moon, by all aspects of the climate. When it is
measured from a land-based facility, the measurement is affected by
changes in the level of the land. There
are many land-based locations
around the world where the level of the sea is measured, and often
automatically recorded. These measurements have been collected
and made available to the public on the Permanent Service for
Mean Sea Level (PSMSL) website (4).
Currently there are some 1850 records listed. They vary considerably in
their length. They also vary in the quality of equipment and the degree
of supervision. The
measurement stations are most often near
large cities in the Northern Hemisphere. They, therefore, cannot
be considered as providing a representative sample of the world’s
oceans. Any averages derived from them cannot be regarded as evidence of
a globally averaged change
in sea level, but only of the particular sites of measurement.
Climate Change 01 (5)
puts it this way: “The
sea level records contain significant interannual and decadal
variability and long records are required in order to estimate reliable
secular rates that will be representative of the last century. In
addition, sea level change is spatially variable because of land
movements and of changes in the ocean circulation. Therefore a good
geographic distribution of observations is required. Neither requirement
is satisfied with the current tide gauge network.” Corrections
to land measurements such as the “Post Glacial Rebound” (the
continued recovery from the last ice age)
and plate movements have to be made by the use of models that are
often based on limited geographical regions, and are prone to large
uncertainties. Again, Climate
Change 01 (5) “However,
this procedure may underestimate the real current eustatic change
because the observed geological data may themselves contain a long-term
component of eustatic sea level rise.” Corrections
due to urban development are even more difficult to make The level of
all cities falls as ground water is removed and heavy buildings are
erected. Tide gauge equipment may itself tend to subside after years of
battering by the sea. The
need for corrections means that the quoted figures for sea level change
bear only a remote relationship to the actual measurements. They are the
result of processing by models and of multiple corrections (3,
6). The
researches of Mörner (7)
of the International Association of Quaternary Research, which are
critical of the IPCC methods, are largely
ignored by them. In
Chapter 3 it is pointed out that many remote weather stations show no
evidence of an overall temperature
rise over the past century. Similarly, there are many of the more
remote, and comparatively stable tide measuring stations which have not
registered a rise. Also, many records showing a rise show a sudden jump
rather than a smooth increase, suggesting a relationship with a
particular event, such as the erection of tall buildings, or an airport,
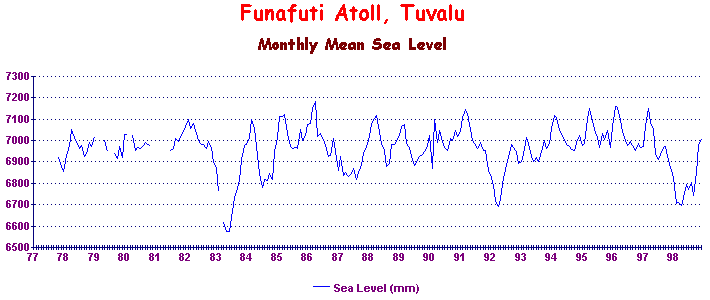
or a change of instruments. As an example, many sea level records for the more remote Pacific islands show no sign of a rise over the past twenty years. Figure 5.1 for Funafuti, the capital of Tuvulu (4) shows that there has been no detectable change in sea level since 1978. Yet there are strident claims that Tuvulu is in danger of being swallowed up by the ocean. The New Zealand Government has agreed to special immigration concessions as a result of this false belief
A recent
National Geographic documentary called “Drowning Paradise”
(8) devotes a whole
hour to this forthcoming tragedy, for which there is no evidence. Other Pacific islands showing no detectable change in sea level (4) are ;
Many others
show a stable period followed by a sudden jump, most likely due to hotel
or airport construction, or a hurricane. Most of them also show no mean
temperature increase over the period. The El Niño events of 1983 and
1998 show low readings. Since 1993
mean sea level has been measured by satellite altimeter
observations. The latest record is shown in Figure 5.2 (9) On
the face of it, it shows a rise in sea level over the period. Cabanes et
al (10) have shown that the
period from 1993 to 1998 is compatible with the ocean temperature measurements of
Levitus et al (11),
referred to in our Chapter 4. However, the later period is heavily
influenced by the 1998 El Niño event; the
satellites have had various problems of calibration and correction (12)
and five years is
an insufficient time to determine a climate trend. It is interesting
that Cabanes et al find that the Topex/Poseidon measurements are double
those estimated from tide gauges, direct
evidence that the tide gauge information is from a distorted, biased
sample. All
the calculations, estimates and forecasts of future sea level behaviour
are dependent on the belief that the earth’s surface temperature is
increasing. If, as is argued in Chapter 3, this is not so, all these,
together with the future projections of sea level rise given in Chapter
11 of Climate Change 01 (13)
can be regarded as
completely without theoretical foundation. To summarise: there is no firm evidence for recent rises in sea level unrelated to land movements and climate events such as El Niño
Figure 5.2 Mean sea level as measured by TOPEX/POSEIDON satellites since 1993 (9) References
1. Climate Change 01 page 4 2. Climate Change 01 page 639 Changes in Sea Level. 3. Climate Change 01 paragraph 11.3.2 Mean Sea Level Changes over the Past 100 and 200 years, pages 661-664 4. Permanent Service for Mean Sea Level (PSMSL) http://www.pol.ac.uk/psmsl/programmes 5. Climate Change 01 page 661 6. Daly, J L 2000 Testing the Waters: A Report on Sea Levels, Greening Earth Society, http://www.greeningearthsociety.org/Articles/2000/sea.htm 7. Mòrner N A 1998 Postglacial variations in the level of the sea: implications for climate dynamics and solid earth geophysics. Review of Geophysics 36 603-689 8. National Geographic Society Documentary 200I “Drowning Paradise” 9. AVISO website http://www.jason.oceanobs.com/html/portail/actu/actu-welcome-uk.php3 10. Cabanes, C, A Casenave, C Le Provost 2001, Science 294 840-842 11. Levitus, S, J I Antonov, T P Boyer, C Stephens 2000, Science 287 2225-2229 12. Climate Change 01 page 663 13. Climate Change 01 Chapter 11, Figures 11.11 and 11.12. pages 670-671.
Return to Chapter list and Summary |
Return to `Climate Change Guest Papers' page
Return to `Still Waiting for Greenhouse' main page