|
Variations
in CO2 Growth Rate Dr Theodor Landscheidt Schroeter Institute for Research in
Cycles of Solar Activity
1. Introduction CO2 concentrations in the atmosphere have increased from about 280 ppmv in pre-industrial times to 372.9 ppmv in 2002. This rise runs approximately parallel with the increase in CO2 emissions from fossil fuel combustion. The 10-year mean of CO2 concentrations increased steadily during the last century. Since 1990 there have been some indications that the increment is levelling off. The average annual increment over the last 10 years was 1.66 ppmv/yr. The curve of the global average CO2 concentrations shows only small deviations from the trend line. The annual growth rates, however, vary significantly. In some cases they go beyond 3 ppmv/yr. According to the World Data Centre for Greenhouse Gases (2003) "The high growth rates in 1983, 1987/88, 1994/1995, and 1997/1998 are associated with warm events of El Niño-Southern Oscillation (ENSO). The anomalously strong El Niño event in 1997/1998 brought about worldwide high increases in 1998. The exceptionally low growth rates in 1992, including negative values for northern high and mid-latitudes, were caused by low global temperatures following the eruption of Mt. Pinatubo in 1991." As this connection could be of great import (Kuo et al., 1990; Metzner, 1996), it is subjected to a detailed analysis.
2.
Connection between extrema in CO2 growth rates I have shown that ENSO events are closely connected with eruptive phases of the 11-year sunspot cycle. This relationship was corroborated by correct long-range forecasts of the last three El Niños and the course of the last La Niña. In addition, I have provided evidence that negative and positive extrema in global temperature anomalies like those in 1992 and 1998 show such a close relationship with solar motion cycles and solar activity that they can be predicted years before the respective event (Landscheidt, 1983-2003). In view of the synchronism described by the World Data Centre for Greenhouse Gases it seems justified to investigate whether there is, too, a link between variations in CO2 growth rates and the solar cycles used in the forecast of global temperature.
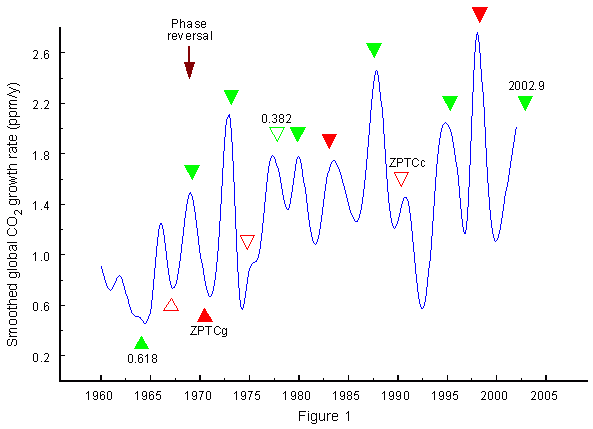
Fig. 1 shows the result. The blue curve displays the yearly growth rate of atmospheric CO2 concentrations (ppmv) derived from in situ air samples collected at Mauna Loa Observatory (Keeling and Whorf, 2003). The data were subjected to 2-year smoothing based on locally weighted least squares (Lowess). The red triangles in the plot indicate zero phases in the absolute rate of change |dL/dt| (torque) in the Sun’s orbital angular momentum related to its irregular oscillation about the centre of mass of the solar system (CM). The mean interval between these zero phases in a torque cycle (ZPTC), emerging in the |dL/dt| time series, is 8 years, but there is considerable variation. The Sun’s orbital motion is governed by difference forces in the same way as the planets’ course around the Sun. Gravitation and centrifugal force are balanced overall, but in single phases of the orbit one of the two forces may prevail. In Figure 1 the filled red triangles mark zero phases ZPTCg that initiate a period of prevailing gravitation and an orbital motion towards the CM, whereas zero phases ZPTCc, indicated by open red triangles, mark the start of dominating centrifugal force and a motion away from the CM. These changes in the physical quality of the solar motion have a strong effect on the distribution of solar eruptions in different regions of the Sun (Landscheidt, 1986 a). The parameter P = 0.618 between consecutive ZPTCs, marked by green triangles, is a regulator of stability in dynamical systems. As to details I refer to Chapter 3 of my on-line paper "Long-Range Forecast of U.S. Drought Based on Solar Activity" (Landscheidt, 2003 a). The arrow at the upper left of Figure 1 indicates a phase reversal in the connection between growth rate extrema and zero phases as well as the parameters 0.618 in the torque cycle. In nearly all of my papers I could show that such phase reversals are a regular feature in climate time series related to solar motion cycles. This is not an ad hoc invention, but a computable phase of instability which occurs when the zero phase of a longer solar motion cycle coincides with a zero phase of a shorter solar motion cycle (Landscheidt, 1983-2003). After the phase reversal in 1968, the zero phases ZPTC (red triangles) and the parameters P at 0.618 of the distance between consecutive zero phases (green triangles) consistently coincide with maxima in the CO2 growth rate. Obviously zero phases ZPTCc (open red triangles) have a considerably weaker effect than zero phases ZPTCg and phases 0.618. In the case of an especially long torque cycle, the parameter 0.382, formed by the symmetry operation 1- 0.618, had a similar effect. This case is marked by an open green triangle. Around the phase of instability in 1968 a reversal in the relationship was in progress.
3. Principal component analysis of solar activity and CO2 growth rates As the intervals between consecutive zero phases show strong variations between 3 and 8 years replicated by the intervals between consecutive growth rate extrema, the good fit cannot easily be dismissed as fortuitous. Monte Carlo experiments show that we are dealing with a rare species. The probability P of a false rejection of the sceptic null hypothesis is much smaller than 0.001. It is not easy to determine what this result means. It could be that ENSO events (El Niño and La Niña) and extrema in global temperature anomalies that have been shown to be predictable because of their connection with solar activity have a secondary effect on CO2 growth rates. It cannot be excluded, though, that there is also a direct effect of solar activity. So the relationship between CO2 growth rates and solar activity has been subjected to a Principal Component Analysis (PCA) that leads to a significant reduction of the amount of data while retaining most of the variance. It has the advantage of identifying smaller subspaces that contain most of the dynamics of the observed system or relationship (von Storch and Zwiers, 1999; Venables and Ripley, 2002). It is then easier to judge the impact of the involved variables on the investigated relationship. The phases ZPTC (red triangles) and P of the torque cycle indicate that extrema of global temperature anomalies go along with enhanced eruptional activity on the Sun. These eruptions and their effect on Earth is best represented by Mayaud’s geomagnetic aa index (Mayaud, 1973). This is the first variable subjected to PCA. The second variable is the international smoothed yearly sunspot number R, as special phases of the 11-year sunspot cycle are linked to ENSO events. The third variable of interest is the yearly CO2 growth rate. As the principal components depend on the scaling of the original variables and aa, R, and CO2 are on very different scales, the variables were normalized to unit. According to the PCA analysis, the first component explains 49 percent of the total variance, the second component 33 percent, and the third component 18 percent. The loadings in the first component as well as in the third component are exclusively ascribed to aa and R, whereas CO2 growth rates solely get loadings in the second component. Overall, the loadings of variables representing solar activity outweigh the CO2 growth rates by far. This is a first indication that in addition to an indirect solar effect via temperature there is a direct solar effect related to solar eruptions accumulating around crucial phases of the torque cycle in the Sun’s irregular orbital motion and in special phases of the 11-year sunspot cycle. Naturally, this first result does not yet provide striking evidence, but it opens new perspectives that should be explored by further investigations that yield more details. Hopefully, such additional results will make it less difficult to find a physical explanation of the potential relationship. As to models that generally explain the Sun’s impact on climate change in different fields there is progress. I refer to the AGU Monograph "Solar Variability and its Effects on the Earth’s Atmosphere and Climate System," edited by J. Pap et al., which is about to appear, and especially the chapter "Atmospheric Ionization and Clouds as Links Between Solar Activity and Climate" by Brian A. Tinsley and Fangqun Yu. Acknowledgements: I thank Peter Dietze who suggested in November 1997 that there could be a link between variations in CO2 growth rates and the solar torque cycle. References: Keeling,
C. D., Whorf, T. P., and the Carbon Dioxide Research Group (2003): Atmospheric
CO2 concentrations (ppmv) derived from in situ air samples collected at
Mauna Loa, Hawaii. Kuo, C., Lindberg, C., and Thompson, D. J. (1990): Coherence established between atmospheric carbon dioxide and global temperature. Nature 343, 709. Landscheidt, T. (1983): Solar oscillations, sunspot cycles, and climatic change. In: McCormac, B. M., ed.: Weather and climate responses to solar variations. Boulder, Associated University Press, 293-308. Landscheidt, T. (1984): Cycles of solar flares and weather. In: Moerner, N.A. und Karlén, W., eds..: Climatic changes on a yearly to millennial basis. Dordrecht, D. Reidel, 475, 476. Landscheidt, T. (1986): Long-range forecast of energetic x-ray bursts based on cycles of flares. In: Simon, P. A., Heckman, G., and Shea, M. A., eds.: Solar-terrestrial predictions. Proceedings of a workshop at Meudon, 18.-22. Juni 1984. Boulder, National Oceanic and Atmospheric Administration, 81-89. Landscheidt, T. (1987): Long-range forecasts of solar cycles and climate change. In: Rampino, M. R., Sanders, J. E., Newman, W. S. and Königsson, L. K., eds.: Climate. History, Periodicity, and predictability. New York, van Nostrand Reinhold, 421-445. Landscheidt, T. (1988): Solar rotation, impulses of the torque in the Sun’s motion, and climatic variation. Clim. Change 12, 265-295. Landscheidt, T.(1990): Relationship between rainfall in the northern hemisphere and impulses of the torque in the Sun’s motion. In: K. H. Schatten and A. Arking, eds.: Climate impact of solar variability. Greenbelt, NASA, 259-266. Landscheidt, T. (1995b): Die kosmische Funktion des Goldenen Schnitts. In: Richter, P. H., ed.: Sterne, Mond und Kometen. Bremen, Hauschild, 240-276. Landscheidt, T. (1998 a): Forecast of global temperature, El Niño, and cloud coverage by astronomical means. In: Bate, R., ed.: Global Warming. The continuing debate. Cambridge, The European Science and Environment Forum (ESEF), 172-183. Landscheidt,
T. (1998 b): Solar activity - A dominant factor in climate dynamics. Landscheidt, T. (2000 a): Solar forcing of El Niño and La Niña. In: Vázquez , M. and Schmieder, B, ed.: The solar cycle and terrestrial climate. European Space Agency, Special Publication 463, 135-140. Landscheidt, T. (2000 b): Solar wind near Earth: Indicator of variations in global temperature. In: Vázquez, M. and Schmieder, B, ed.: The solar cycle and terrestrial climate. European Space Agency, Special Publication 463, 497-500. Landscheidt, T. (2000 c): River Po discharges and cycles of solar activity. Hydrol. Sci. J. 45, 491-493. Landscheidt,
T. (2000 e): New confirmation of strong solar forcing of climate. Landscheidt,
T. (2001 a): Solar eruptions linked to North Atlantic Oscillation. Landscheidt,
T. (2001 b): Trends in Pacific Decadal Oscillation subjected to solar
forcing. Landscheidt, T. (2002): El Niño forecast revisited. < http://www.john-daly.com/sun-enso/revisited.htm > Landscheidt,T.
(2003 a): Long-range forecast of U.S. drought based on solar activity. Landscheidt,
T. (2003 b): New Little Ice Age instead of global warming. Energy
and Environment Mayaud, P. N. (1973): A hundred year series of geomagnetic data. IUGG Publication Office, Paris. Metzner, H. (1996): Gibt es einen CO2 – induzierten Treibhauseffekt? In: Metzner, H., ed.: Treibhauskontroverse und Ozonproblem. Europäische Akademie für Umweltfragen, Leipzig. |