|
Decadal-Scale NAO Forecast by Schroeter Institute
for Research in Cycles of Solar Activity
1.
Introduction The North Atlantic
Oscillation (NAO) refers to swings in
the atmospheric sea level pressure differences between the Arctic and the subtropical Atlantic. It exerts a strong
control on winter climate in Europe, North America, and Northern Asia. The NAO index is
defined as the normalized pressure difference between measurements of stations
on the Azores and Iceland. A positive NAO index indicates a stronger than usual
subtropical high pressure center and a deeper than normal Icelandic low. The
increased pressure difference results in more and stronger winter storms
crossing the Atlantic Ocean on a more northerly track. This results in warm and
wet winters in Europe and cold and dry winters in Greenland and Northern
Canada, while the eastern Unites States experience mild and wet winter
conditions. A negative NAO index points to a weak subtropical high and a weak
Icelandic low. The reduced pressure gradient results in fewer and weaker winter
storms crossing mostly on west-east paths bringing moist air into the
Mediterranean and cold air to Northern Europe. The east coast of the United
States gets more cold air and snow while Greenland enjoys mild winters
(Hurrell, 1995). Despite these
significant impacts of the NAO, it is not yet known which climate processes
govern NAO variability, how the phenomenon has varied in the historical past,
and to what extent it is predictable. Hurrel (2003) holds that the variations
in the NAO are largely unpredictable as they arise from internal stochastic
interactions between atmospheric storms and the mean atmospheric flow producing
random fluctuations. He seems to take it for granted that the NAO is a free
internal oscillation of the climate system not subjected to external forcing. I
have shown however (Landscheidt, 2001a) that
the NAO is closely related to energetic solar eruptions. This external
forcing is corroborated by evidence that other dominant modes of global climate
variability like the El Niño/Southern Oscillation (ENSO)
(Landscheidt, 2000a) and
the Pacific Decadal Oscillation (PDO) (Landscheidt, 2001b) are so closely
linked to the sun’s eruptional activity and
special phases in solar cycles that long-range forecasts can be based on
this relationship. The last three El Niños and the course of the last La
Niña were correctly predicted on this
basis years ahead of the respective events (Landscheidt,
2002). Moreover, it
has been shown that the coolest phase of the current cold PDO regime is to be
expected around 2007 and the next
regime shift from cold to warm around 2016 (Landscheidt,
2001b). The
inter-annual
forecast of ENSO events has meanwhile been completed by a model that predicts
El Niño and La Niña activity on a decadal scale (Landscheidt, 2003c). A
similar model is presented here for the NAO. The forecasts cover the first half
of this century.
2. Analysis of yearly NAO index and forecast of
NAO trend
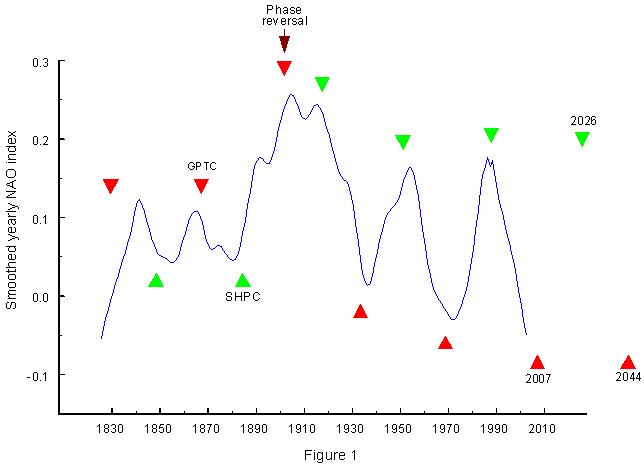
The blue curve in
Fig. 1 shows yearly means of the NAO index covering the period 1825 to 2002.
Jones et al. (1997) used early instrumental data to extend this index back to 1825. Data with lots of missing values go back to 1821, but were
excluded here. The index is available at the Climate Research Unit of the
University of East Anglia (2003). To see the trend, the time series was subjected
to 30-year moving window Gaussian kernel smoothing (Lorzcak). The cyclic pattern of the curve is closely
linked to a well-investigated solar motion cycle. I have shown that the North
Atlantic Oscillation (NAO), the Pacific Decadal Oscillation
(PDO), El Niño and
La Niña, extrema in global temperature anomalies, drought in Africa and U.S.A.,
as well as European floods are linked to cycles in the sun’s irregular orbital
motion around the center of mass of the solar system (Landscheidt, 1983-2003).
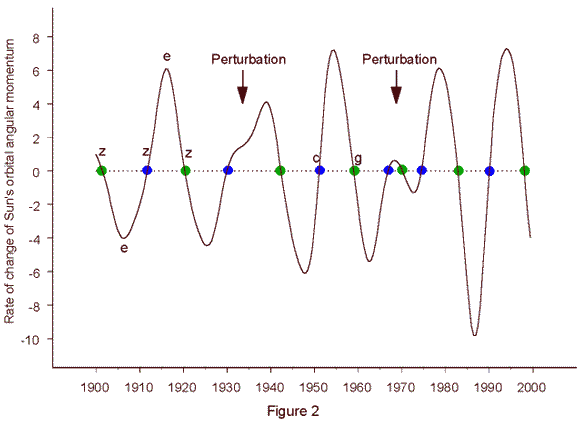
The rate of change of the sun’s orbital angular momentum L - the rotary force dL/dt
driving the sun’s orbital motion (torque) - forms a torque cycle with a mean
length of 16 years (Landscheidt, 2001a,b). Perturbations in the sinusoidal
course of this cycle recur at quasi-periodical intervals and mark zero phases
of a perturbation cycle (PC) with a mean length of 35.8 years. These zero
phases are called instances of greatest perturbation in the torque cycle
(GPTC). As to details, I refer to Figure 2 of my on-line paper
“Solar eruptions
linked to North Atlantic Oscillation” (Landscheidt, 2001 a). The GPTC phases play an important role in the
long-range forecast of diverse climate phenomena. They indicate, for instance,
the peaks of warm PDO regimes and the coolest phases of cold PDO regimes
(Landscheidt, 2001b) and are closely linked to extended dry and wet spells
measured by the U.S. drought index (Landscheidt, 2003
a). As to the details and
physical implications of the Sun’s irregular orbital motion I refer to my
papers “New Little Ice Age instead of global warming?” (Landscheidt, 2003b) and
“Extrema in Sunspot Cycle Linked to Sun’s Motion" (Landscheidt, 1999). Another approach to the 35.8-year cycle has
been presented in Fig. 3 of my paper “Trends in Pacific Decadal Oscillation Subjected to Solar
Forcing” (Landscheidt,
2001b). It has been shown that absolute values of the torque cycle
(|dL/dt|) form a shorter cycle that plays, e. g., a major role in solar forcing
of the North Atlantic Oscillation (Landscheidt, 2001a) and discharges in river
catchment areas (Landscheidt, 2000c,d). When a Gaussian low-pass filter
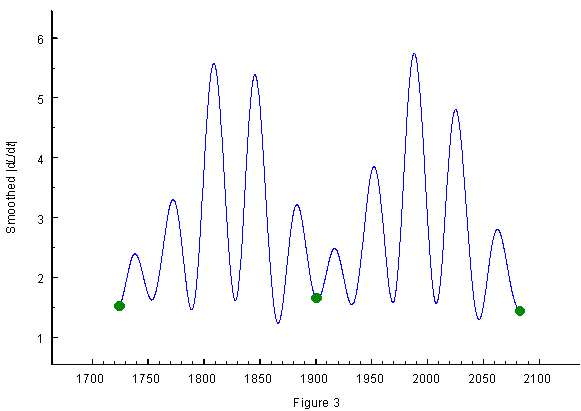
suppressing wavelengths shorter than 9 years is applied to |dL/dt|, new
oscillations emerge as shown in Fig. 3 of the quoted paper for 1721 - 2077. Minima
in the smoothed |dL/dt|-curve are identical with initial phases GPTC in the
perturbation cycle. So it is easy to compute the precise dates of these phases
for any period. Within the range of the investigated NAO index, GPTCs fall at
1829.5, 1867.2, 1901.8, 1933.6, 1968.9, and beyond that range at 2007.2, 2044.9., and 2080.7. In nearly all of my papers I could show that
there are phase reversals in the climate time series related to solar motion
cycles (Landscheidt 1983-2003). These are not ad hoc inventions, but computable
phases of instability that occur when the zero phase of a longer solar motion
cycle coincides with a zero phase of a shorter solar motion cycle. The arrow in
Fig. 1 indicates a zero phase of the 179-year cycle, described in my paper
“Decadal-scale variations in El Niño intensity” (Landscheidt, 2003c), which
coincides with the GPTC phase 1901.8. After the phase reversal around 1902, all deep
minima in the NAO curve coincide with GPTCs indicated by red triangles. Before
1902 the relationship is reversed. GPTCs go along with outstanding maxima in
the curve. Only GPTC 1829.5 does not fit. This could be an effect of the
deteriorating quality of the earliest data in the index reconstruction. The
green triangles point to zero phases of the second harmonic of the perturbation
cycle (SHPC) in between GPTCs. After the phase reversal they consistently
coincide with maxima in the NAO curve and before 1902 with minima. The extended maximum between 1890 and 1920 can
be explained by the phase reversal.
After the GPTC 1901.8, going along with a maximum, a minimum was to be expected
in the regular course of the oscillation. Instead, another maximum appeared
because of the phase reversal. The situation is comparable to the Medieval
Maximum of solar activity that can also be explained by such a phase reversal
(Landscheidt, 2003b). Another extended NAO maximum of this kind is not to be
expected in the foreseeable future as the next phase reversal related to a zero
phase in the 179-year cycle will not occur before 2080. Accordingly, the oscillatary pattern
established after the phase reversal should stay stable. A forecast of the NAO
trend can be read from Fig. 1. Deep minima in the trend curve are to be
expected around 2007 and 2044 and an
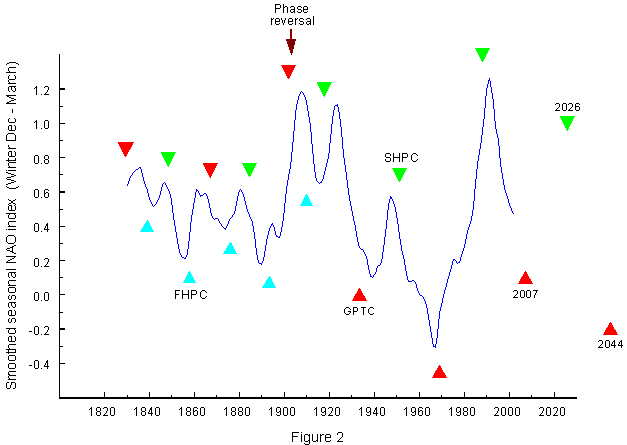
outstanding maximum around 2026. 3. Analysis and forecast of NAO winter season
The effects of the NAO are most noticeable in
the winter months December to March (Jones et al,
1997). The blue curve in Fig
2 shows these seasonal values. They were subjected to Gaussian kernel smoothing (Lorzcak) with a narrower 15-year
moving window to get a more detailed
trend perspective. As can be seen from the figure, the pattern after the
phase reversal is nearly the same as in Fig. 1 so that there is no need to
formulate a more differentiated trend forecast. There is, however, some change
in the period before the phase reversal. The SHPCs (green triangles) are
related to maxima, as after 1902, and
more frequent minima go along with the fourth harmonic of the 35.8-year
perturbation cycle (FHPC) indicated by smaller triangles in cyan colour.
Theoretically, this is interesting, but it has no effect on the development in
the foreseeable future.
4. Link between NAO and solar eruptions I have shown in several papers that energetic solar eruptions (coronal mass
ejections, flares, and eruptive prominences) have a strong effect on diverse
climate phenomena including El Niño and La Niña (Landscheidt,
1983-2003). So it
suggests itself to investigate whether energetic solar eruptions are connected
with NAO variations, too. Not all strong solar eruptions have an impact on the
near-Earth environment. The effect at Earth depends on the heliographic
position of the eruption and conditions in interplanetary space. Indices of
geomagnetic activity measure the response to those eruptions that actually
affect the Earth. Mayaud’s aa index (Mayaud, 1973; Coffey, 1958-1999) is
homogeneous and covers a long period back to 1868. So I compared the aa index
with the NAO data of this period.
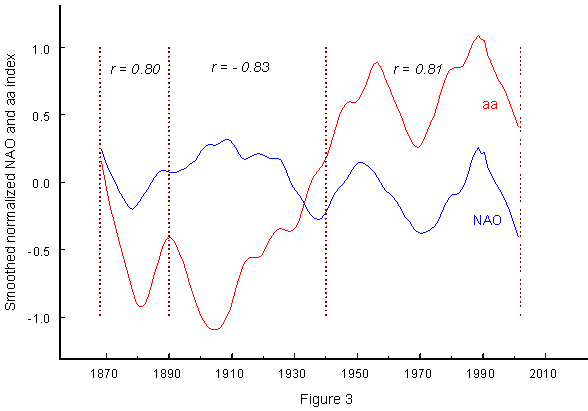
Figure 3 shows the result. The red curve
represents yearly means of the aa index, normalized to the standard deviation
and subjected to 30-year moving window
Gaussian kernel smoothing (Lorzcak). The blue curve shows the yearly NAO index
treated in the same way. Between 1940 and present the two time series show a
clear positive correlation. The correlation coefficient is as high as r
= 0.81 and explains 66 percent of the variance. Also from 1868 to 1890
the correlation is positive and strong: r = 0.80. Between 1890 and 1940,
however, the correlation is negative and reaches r = - 0.83.
Bootstrap re-sampling, making use of 500,000 samples drawn at random from the
observed set, shows that there is less than 1 chance in 50,000 to falsely
reject the sceptic null hypothesis of
no correlation. The change in the sign of correlation is not as
strange as it seems at first sight. It is a first indication that the quality
of the solar effect on climate depends on the level of solar activity. The red
curve in Fig. 3 shows clearly that the sun’s eruptional activity was much
weaker before 1940 than afterwards. It will be rather difficult to explain the
different effect of high and low solar activity in strict physical terms, but
there are at least indications now where to search for explanations. Revealingly, the correlation between NAO and
sunspot numbers R is much weaker
than between NAO and aa. Between 1868 and 1890 and 1940 to present it is
smaller than r = 0.5. This corroborates the hypothesis put forward in
nearly all of my papers that the sun’s eruptional activity is the most potent
driving force behind climatic change, much stronger than the relatively weak
variations in the sun’s irradiance in the course of the 11-year sunspot cycle.
As GCMs do not take the effect of solar eruptions into account, they do not
reflect reality.
5.
Background and Outlook It is to be expected that the presented results
will be dismissed as a statistical artifact as there is no detailed causal
explanation of the relationship between NAO and solar eruptions in strict terms
of physics. Yet how could this be done as long as climatologists have no
physical explanation of the NAO. The positive and negative modes of this
phenomenon establish covariations, but do not explain them (Leroux, 2003). Only
a few years ago Wanner (1999) commented: “How and why does the NAO see-saw from
one mode to another? … Despite many studies this question remains open and the
mechanism of the flip flop quite mysterious.”
Quite recently Hurrell (2003), a specialist at NAO research, conceded
that “many open issues remain about which climate processes govern NAO
variability…” Hopefully, Mobile Polar High (MPH)
dynamics as described by
Leroux (1993, 2003) will contribute to a solution of the problem. IPCC proponents
prayer-wheel-wise repeat the mantra that in recent decades the effect of solar
activity on climate has marvellously disappeared. Figures 1 to 3 and the
statistical analysis of the correlation between the aa index and NAO up to the
present show clearly that with regard to the North Atlantic Oscillation this is
not true. Just in the decades 1970 to
present the correlation between aa and NAO is closest and reaches r =
0.97. Earlier investigations have shown that
in recent decades the other dominant modes of climate variability, ENSO
and PDO, have been subjected to such strong solar forcing that forecasts can be
based on this relationship (Landscheidt, 2001b,
2002). So the textbook tenet
that NAO, ENSO, and PDO are free internal oscillations of the climate system
not subjected to external forcing is no longer tenable and the claim that the
solar effect has not been observed for decades is inconsistent with facts. Fig. 2 shows that
there have been strong variations in the NAO index in recent decades. Hurrell
(2003) thinks that they provide “relatively strong evidence that … increases in
greenhouse gas concentrations are influencing the recent behaviour of the NAO.”
Here he seems to suppose that solar forcing is negligible. The presented
results show that this conclusion is not justified. IPCC proponents
continue to contend that there are no professional physical models that could
explain the effect of solar eruptions on climate. In Chapter 4 of my paper
“Long-range forecast of U.S. drought based on solar activity” I have given an
overview of such models (Landscheidt, 2003a). Meanwhile, Benestad
(2002) has
written a book on “Solar Activity and Earth’s Climate“ which reviews the rich
literature on physical explanations of the widely reported correlations between
magnetic activity in the outer layers of the sun and changes in weather and
climate on planet Earth up to 2001 (Tinsley,
2003). It is a valuable update of the comprehensive
review by Herman and Goldberg (1978) propagated by NASA before the beginning of
the global warming debate. I am not optimistic enough to assume that IPCC
adherents will read this book, but I am convinced that it will stimulate
research by unprejudiced independent scientists so that, some day, a detailed
physical explanation of the relationship between solar eruptions and variations
in the NAO will be found. References Benestad, R.
(2002): Solar activity and Earth’s climate. Springer, New York. Climate Research
Unit of the University of East Anglia (2003): Coffey, H. E.,ed.
(1958-1999): Solar-Geophysical Data Center, Boulder http://www.cru.uea.ac.uk/~timo/projpages/nao_update.htm Hurrell, J. W.
(1995): Decadal trends in the North Atlantic Oscillation and relationships to
regional temperatures and precipitation. Science 269, 676-679. Hurrell, J. W.
(2003): The North Atlantic Oscillation: Climatic significance and environmental
effect. EOS 84, No. 8, 25 February 2003, 73. Jones, P. D.,
Jonsson, T., and Wheeler, D. (1997): Extension to the North Atlantic
Oscillation using early istrumental pressure observations from Gibraltar and
south-West Iceland. Int. J. Climatol. 17, 1433-1450. Landscheidt, T.
(1983): Solar oscillations, sunspot cycles, and climatic change. In: McCormac,
B. M., ed.: Weather and climate responses to solar variations. Boulder, Associated
University Press, 293-308. Landscheidt, T. (1984): Cycles
of solar flares and weather. In: Moerner, N.A. und Karlén, W., eds..: Climatic
changes on a yearly to millenial basis. Dordrecht, D. Reidel, 475, 476. Landscheidt, T.
(1986 a): Long-range forecast of energetic x-ray bursts based on cycles of
flares. In: Simon, P. A., Heckman, G., and Shea, M. A., eds.: Solar-terrestrial
predictions. Proceedings of a workshop at Meudon, 18.-22. Juni 1984. Boulder,
National Oceanic and Atmospheric Administration, 81-89. Landscheidt, T.
(1987): Long-range forecasts of solar cycles and climate change. In: Rampino,
M. R., Sanders, J. E., Newman, W. S. and Königsson, L. K., eds.: Climate.
History, Periodicity, and predictability. New York, van Nostrand Reinhold,
421-445. Landscheidt, T.
(1988): Solar rotation, impulses of the torque in the Sun’s motion, and
climatic variation. Clim. Change 12, 265-295. Landscheidt,
T.(1990): Relationship between rainfall in the northern hemisphere and impulses
of the torque in the Sun’s motion. In: K. H. Schatten and A. Arking, eds.:
Climate impact of solar variability. Greenbelt, NASA, 259-266. Landscheidt, T. (1995b): Die kosmische
Funktion des Goldenen Schnitts. In: Richter, P. H., ed.: Sterne, Mond und
Kometen. Bremen, Hauschild, 240-276. Landscheidt, T.
(1998 a): Forecast of global temperature, El Niño, and cloud coverage by
astronomical means. In: Bate, R., ed.: Global Warming. The continuing
debate.
Cambridge, The European Science and Environment Forum (ESEF), 172-183. Landscheidt, T.
(1998 b): Solar activity - A dominant factor in climate dynamics.
Landscheidt, T.
(2000 a): Solar forcing of El Niño and La Niña. In: Vázquez , M. and Schmieder, B, ed.:
The
solar cycle and terrestrial climate. European Space Agency, Special Publication
463, 135-140. Landscheidt, T.
(2000 b): Solar wind near Earth: Indicator of variations in global
temperature. In: Vázquez, M. and Schmieder, B, ed.: The solar cycle
and terrestrial climate. European Space Agency, Special Publication 463,
497-500.
http://mitosyfraudes.8k.com/Calen/SolarWind.html. Landscheidt, T.
(2000 c): River Po discharges and cycles of solar activity. Hydrol. Sci. J. 45,
491-493. Landscheidt, T.
(2000 d): New confirmation of strong solar forcing of climate. Landscheidt, T.
(2001 a): Solar eruptions linked to North Atlantic Oscillation. Landscheidt, T.
(2001 b): Trends in Pacific Decadal Oscillation subjected to solar
forcing. Landscheidt, T.
(2002): El Niño forecast revisited. http://www.john-daly.com/sun-enso/revisited.htm. Landscheidt,T. (2003
a): Long-range forecast of U.S. drought based on solar activity. Landscheidt, T. (2003
b): New Little Ice Age instead of global warming. Energy and Environment 14,
327-350 http://mitosyfraudes.8k.com/Calen/Landscheidt-1.html Landscheidt, T.
(2003c): Decadal scale variations in El Niño intensity. Leroux, M. (1993):
The Mobile Polar High. Global and Planet. Change 7, 69-93. Leroux, M. (2003):
Global warming: Myth or reality. Energy & Environment, Vol. 14, Nos . 3 and
4, 297-322 Mayaud, P. N. (1973):
A hundred year series of geomagnetic data 1868-1967. IAGA Bulletin No. 33, IUGG
Publications Office, Paris. Tinsley, B. (2003):
Book review: Solar activity and Earth’s climate. Wanner, H. (1999): Le balancier de l’Atlantique Nord. La Recherche 321, 72-73. |