Sea Level at Hobart, Tasmania
A Failure to Authenticate
John L. Daly
(11 June 2003)
![]()
Primary References for this discussion
[1]
(Apr. 2003)
J. Hunter, R. Coleman, D. Pugh,
- The Sea Level at Port Arthur, Tasmania, from 1841 to the Present
GEOPHYSICAL RESEARCH LETTERS, Vol. 30, No. 7, 1401, April 2003
[2] (Nov. 2002)
D. Pugh, J. Hunter, R. Coleman, C.
Watson,
A Comparison of Historical and Recent sea Level Measurements at Port
Arthur, Tasmania,
INTERNATIONAL HYDROGRAPHIC REVIEW, vol.3, no.3 (new series), November
2002.
(Other references listed at the end)
|
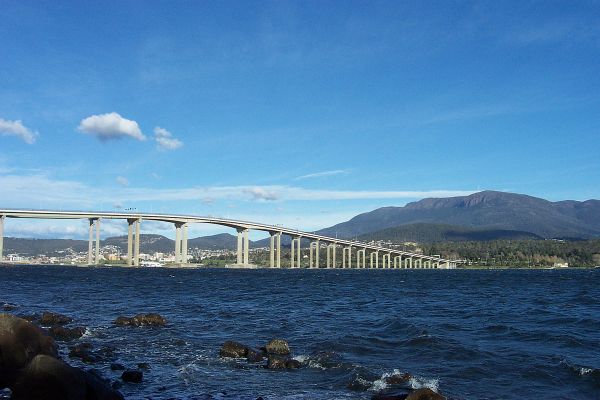
Introduction In April 2003, a paper published in Geophysical Research Letters (GRL) by J. Hunter, R. Coleman and D. Pugh [1] repeated results published by these same authors 5 months earlier [2] of a study into a 160-year-old sea level benchmark at Port Arthur, Tasmania. In the course of their 2003 GRL paper, they claimed that sea levels in Hobart (the state capital of Tasmania), have risen in the last century based a comparison between modern sea level and a 30-year series of tide data dating from 1875 to 1905. The purpose of this discussion is to demonstrate that the Hobart sea level claim made in the GRL paper [1] was not only tenuous, but that the key reference to authenticate that claim, as provided by the authors, does not provide the information necessary to validate the claims they made.
The Isle of the Dead, Port Arthur
(At this point, it is suggested that the reader become familiar with the background to the story and the sea level issues raised - See `Isle of the Dead Revisited' Part 1 and Part 2 [12]) In April 2003 the same authors published a short 4-page paper in Geophysical Research Letters (GRL) [1] which briefly summarised the findings and reasoning of their earlier, more detailed paper (one of the co-authors of the first paper, Chris Watson, did not co-author the GRL paper) However, additional material was introduced in the GRL paper which Hunter et al used to reinforce their argument. It is best shown via the chart of sea level changes they presented in 2002, and then in 2003. |
Fig 3. - Sea Level History at Port Arthur
according to the 2002 paper
[2]
| The diagram shown above formed the basis for the
series of diagrams presented in my critique articles. However, the new
material in their latest paper of April 2003 in GRL had not
been addressed in my 2-part article due to lack of source references
provided by them up
to that time.
Here is their revised version of the diagram, adapted from their GRL paper [1]. |
Fig.4 - The Port Arthur History with the `State Datum' claim added (my highlight colours)
| The area shaded in yellow with the label `State
Datum' was added by Hunter et al. It came complete with a 30-year (1875-1905) timeline
of data for that datum, and a calculated uncertainty range for the full
30-year period. The most obvious problem is that this datum is about
21 centimetres (or about 8 inches) lower than a published measurement
reported by Cmdr. J. Shortt [7], even though both were from the same
period and from adjacent nearby harbours.
Such a crucial piece of new evidence should be thoroughly authenticated by the authors. Indeed the scientific readers of Geophysical Research Letters would expect nothing less. With the claim now made, referenced and published, other scientists (such as those in the IPCC's next report) are free to cite Hunter et al if they wish to repeat their `state datum' claim and by extension to claim that sea level in Hobart has risen during the 20th century. To determine if this claim could be validated, I followed up the citation given by Hunter et al.
The Hunter et al Citation Hunter et al twice cited the following - and only - reference in support of their `state datum' claim - Government of Tasmania, Report and Proceedings of the Standing Committee of the Coordination and Correlation of Levels and Surveys in Tasmania, 22, Government of Tasmania, January 1941. My first attempt to locate this document was made via the State Library of Tasmania. The library failed to locate it, explaining that the only Government of Tasmania document No.22 of 1941 registered in their archives was titled `Titles, Recorder of, and Registrar of Deeds: Report for 1940-41', hardly the title I was looking for. I then approached the Surveyor-General's office [9] in Hobart for assistance in locating the correct document. They did so, and sent me a copy [10], the entire document comprising a cover page, one blank page, a 4-page letter, 13 pages of committee meeting minutes, and 3 pages of diagrams - 22 pages in all. The cited document does not contain any technical information about the `state datum', neither its height, nor the years of data involved in its calculation, nor the method of determination, nor even the existence of a `state datum' at the time the document was written. It is therefore of no scientific value to any researcher attempting to validate Hunter et al's claim about sea level change in Hobart. None of the other references cited were relevant to the issue either. Having said that, what information does the cited document contain? See a full copy of the reference cited by Hunter et al here (437K Microsoft Word file). According to the document, during the 2nd World War, the Australian Defence Department asked the Tasmanian Government to emulate other Australian states by establishing a unified network of land-based benchmarks for the purpose of surveying landmarks, property boundaries, roads, railways, forests etc. To meet this request, the state government of the day set up a `Standing Committee' of representatives from key government departments (Hydro-Electric Commission, Mines Department, Public Works Department, Railway Department, Forestry Department, the Hobart City Council, the Surveyor General's office, and the Lands Department). No marine or port authorities were represented in this process. The Standing Committee formed two sub-committees to work out the details, and the meetings of these various committees took place during June, July and August of 1940, the minutes of which were incorporated into the overall document. Their final proposals, outlined in a 4-page letter from the Standing Committee to the Minister for Lands and Works, dated 31st January 1941 (p.3-6), was that all survey benchmarks in Tasmania be referenced against one master benchmark, to be designated `BM No.1' and that similar survey benchmarks be established all across Tasmania, all of them referenced back to BM No.1. They even specified an exact design for the benchmarks and forms to be used by other agencies (p.20-22). As for BM No.1, one of the sub-committees recommended that it be placed "at the Derwent Bridge Head at Government House Point" (p.8) and that it should be height referenced against `mean sea level' (MSL) at Derwent Bridge Head (p.15). Since a tide gauge existed there already with readings kept `over a period of years' (p.8), the sub-committee opted for the MSL as determined at Derwent Bridge Head (p.8) rather than use the Hobart Marine Board datum which had been in use for many years. No other details about either datum was given. However, the Derwent Bridge choice of sea level datum was over-ruled three weeks later at a meeting of the full Standing Committee who decided that it would be preferable to adopt the older sea level datum established previously by the Hobart Marine Board for local harbour purposes, and already in widespread use by the Hobart City Council for its survey maps and other survey documents (p.18). Here is the relevant extract (p.17-18) from the minutes of that Standing Committee meeting (20th August 1940 - italic notes added by me for clarification about individuals present)
The `state datum' referred to above was a recommendation for a future survey policy, not something which existed at the time. Prior to these meetings in the 1940s, there was no such thing as a `Tasmanian State Datum'. There was also no technical information given about the Hobart Marine Board's sea level datum, merely that one existed. The minutes revealed that they actually had not one, but two MSL datum levels to choose from - a recent (1940) one from the Derwent Bridge tide gauge, close to the intended BM No.1, and another, older, level determined by the Hobart Marine Board and already in widespread use at that time by the Hobart City Council. Neither the letter nor the attached minutes or diagrams gave any information about what the sea level heights were, how they were determined, or over what time period. The Marine Board of Hobart was not represented on any of the committees, so the issues under discussion were not related to sea level per se, but to land-based survey issues.
The `State Datum' Since the reference given by Hunter et al was of little value, I sought assistance from the Surveyor-General's office of the Department of Primary Industries, Water & Environment in Hobart to find out more about the old `state datum' - and its predecessor, the Hobart Marine Board datum. Following from the report of the Standing Committee in 1941, the Government of Tasmania enacted most of the committee's recommendations in the `Survey Co-ordination Act 1944'. This led to the establishment of BM No.1 and it was defined as being 35.45 feet above MSL, using the old Hobart Marine Board determination of that level. It was this level which then became the `state datum' in 1946 and remained that way until a national system (Australian Height Datum) had been adopted in the 1970s [9]. The new unified survey scheme was illustrated in this `Station Diagram' [14], dated 1946, titled `Level Datum' and subtitled `The Survey Co-Ordination Act, 1944' which the Surveyor-General's office obtained for me. This station diagram was not part of the 1941 document cited by Hunter et al. |

Fig. 5 - The new
survey scheme illustrated (circa 1946)
[14]
|
As we can see, B.M. No.1 (left side of the diagram) was established and defined as 35.43 feet above MSL (the thick connecting line), the MSL itself being determined from a `reference mark' (top centre) which is itself 12.43 feet above the zero level. It is not known today how these values were determined, or by whom, merely that they were circulated widely to other departments at the time. The information relevant to Hobart sea levels is the datum value itself given by the `reference mark' and more importantly, the little hand-written note at the bottom right of the document titled `Reference Mark'. The note says -
"Cut on Stone Foundation of Tide Gauge Office, Hobart
Marine Board, The information specified in that note is consistent with the datum line given by Hunter et al, as is the 30-year time span for the determination of the datum indicated in their GRL paper. This station diagram would appear to be one reference that Hunter et al should have offered in support of their claim. Even this document would not be a sufficient reference on its own as there is no indication as to how the final figure of 12.43 ft was determined, or by whom, or when. Firstly, can the information contained in the station diagram be independently validated today? The reference mark the station diagram refers to still exists, as does the tide gauge `office' (actually an octagonal brick hut) to which it refers (photo).
The `reference mark' is located on the rear side of the hut, in the brickwork near the ground, and is roughly at the same level as the top of the briefcase shown. The mark today is 16 centimetres (about 6½ inches) closer to modern Australian Height Datum than the 12.43 feet specified in the 1946 station diagram [9]. This would imply a sea level rise of 16 centimetres since 1905 when the data from that tide gauge ended and around which the 1946 `state datum' was determined. Secondly, can the 12.43 ft height of the reference mark above MSL at the Hobart tide gauge pre-1905 be authenticated today? The short answer is no. [9] While the old tide gauge hut still exists, the tide gauge mechanism is no longer there. There is no surviving information as to what type of gauge was installed [13]. All that is left inside the hut is a stilling well for the water. Historical measurements from that tide gauge still exist but the height of the tide gauge zero is unknown. In other words, the measurements themselves are not referenced to anything, and the absence of the mechanism in the hut means we cannot today establish what that reference was. The 12.43 ft height given in the 1946 station diagram provides no other details as to the methods employed or who even wrote it. Thirdly, can the 30-year span of data pre-1905, as stated in the 1946 station diagram, and also stated five times in the GRL paper, [1], be verified? Hunter et al stated -
"In 1905, the Tasmanian State
Datum was defined, based on observations of mean It is clear from the contents of the reference they cited [10] that a `Tasmanian State Datum' did not exist as such in 1905. Instead, there was only a Marine Board of Hobart datum for local use in Hobart only. Therefore the phrase "In 1905, the Tasmanian State Datum was defined..." is not strictly correct as the adoption of a `state datum' was not introduced until 1946. In respect of the 30-years of data from 1875-1905, the 1946 station diagram is at odds with other information regarding tide data from Hobart. In 1889, in a peer reviewed paper in the Royal Society of Tasmania journal [11], Mr A. Mault reported that due to a lack of any tide information about Hobart at that time, he went to the extra-ordinary lengths of borrowing a tide gauge from a visiting ship and mounting it on New Wharf, Hobart, to collect tide data during February 1889. He published the full months data in the paper and drew several conclusions about it. Mault even levelled the mean tide of that data to a benchmark at the Hobart Town Hall. He said in the paper -
"Please note that
these observations are only for one month, and that, as probably the Since this was all taking place in 1889, it is clear that there was no known data being collected prior to that time because - "At Hobart, this is of no great consequence, as the depth of water in the harbour is such that the comparatively small rise and fall of tide does not much affect sailing arrangements." It was only from 1889, not 1875, that the Marine Board decided to obtain an automatic tide gauge so that Mault's observations could be continued. The Surveyor-General's office [9] and the CSIRO [13] confirmed that to their knowledge, the pre-1905 data from the Marine Board tide gauge began in December 1889, not 1875, which fully agrees with the information given in the Royal Society journal of 1889. This key point about start dates for Hobart tide data is also affirmed by other sources. According to the website of the Intergovernmental Oceanographic Commission - "Previous gauges have operated in Hobart since 1889." That same information was repeated on the NOAA website. The National Tidal Facility at Flinders University, Adelaide, South Australia, say largely the same thing - "Observations between 1889 and December 1994 exist. The observations may not be continuous over this time period." Even the local newspapers and the Royal Society of Tasmania papers of the time show little or no information about tides prior to 1889. However Hunter et al stated they `have estimated the mean sea level relative to the benchmark for 1875-1905' and charted this on their diagram with a calculated uncertainty range going back to 1875. This statement by them, and their charting of the results, is at odds with information from these other sources which establish 1889, not 1875, as the start date for tide data in Hobart. The only known reference to earlier years comes from that 1946 station diagram from the Surveyor-General's office (which was not referenced by Hunter et al) which merely says MSL was `determined over a period of 30 years previous to AD 1905', with no further details given. That statement in the hand-written note on the 1946 station diagram is inconsistent with the other information which says the time span for tide data at Hobart was 16 years, not 30 years. This then raises questions about the credibility of the 12.43 ft height above MSL it claims for the reference mark at the hut. The core of the problem clearly lies in the inadequacy of the reference provided by Hunter et al in their GRL paper as that reference does not lead to any details about tides in Hobart or the years involved, nor the 1875 start date they indicated.
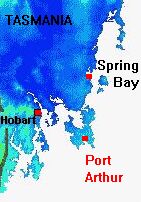
Was There a Sea Level Rise at Hobart? The estuaries of Port Arthur and Hobart are directly adjacent and both face south to the Southern Ocean, so any sea level change - or lack of change - at one must also apply to the other. Shortt's 1888 datum [7] indicates negligible sea level change at Port Arthur between 1888 and now, while the old Hobart Marine Board datum (later to become the `state datum' in 1946) indicates a rise. With a 21 cm difference between them, the two datum levels are mutually exclusive, so at least one of them must be wrong. The Shortt 1888 datum was peer reviewed information published in a scientific journal. (Shortt was the government meteorologist of the day, noted for being meticulous in his work, and published several papers in the Royal Society journal.) For that 1888 datum, we know who did it, the date it was done, the time it was done, and the measurement itself. Any researcher anywhere in the world can obtain a copy through the State Library of Tasmania. By contrast, the 1946 station diagram which Hunter et al did not reference, contains no information as to who prepared it, who calculated the 12.43 ft height, how it was calculated, how much data was used, or what the quality of that data was - and it even claims a 30-year spread of data pre-1905 which is not verified or supported by any other known source. In spite of this, we should still attempt to determine if there really has been a sea level rise of 16 centimetres as suggested by the difference between the old Hobart Marine Board datum and the modern Australian Height Datum. Data from the Permanent Service for Mean Sea Level [8] shows Hobart with negligible sea level rise since around 1960. |
Fig.7 - Sea Level at Hobart 1960-2000
[8]
The red line is the long-term average of the whole data. As is
readily evident, there has been little change over the 40-year period
since 1960 other than short-term changes. The reason for the big anomalies
1974-1976 and 1985 is unknown, but may be the result of equipment
problems as they are too big to have natural causes. Those
anomalies aside, the rest of the data shows little change.
|

Fig.9 - Monthly MSL at Ushuaia, Tierra Del Fuego, Argentina
Fig.10 - Monthly MSL at Albany, Western Australia
|
If there had been a sea level rise of 16 centimetres at Hobart, it could only have occurred between 1905 and 1960, almost certainly too short a time for such a large sea level rise. There is certainly no visible evidence of such a rise, such as with the width of Eaglehawk Neck as discussed in the `Isle of the Dead Revisited' [12]. (See also Appendix here regarding another long-term tide gauge at Fort Denison in Sydney Harbour.) It could also be argued that the 1941 Standing Committee might not have recommended using the old sea level datum from the Marine Board of Hobart in preference to a more modern (1940) datum available to them from Derwent Bridge if they had been aware of a 16 centimetre difference between the two. To do so would have obvious consequences for public works such as drainage, sewage outflows, land reclamation, and port infrastructure. If so, it would suggest there was only a slight difference between the two, leading to the obvious inference that the postulated 16 cm sea level rise could only have occurred in the 20 years between 1940 (when the committees met) and 1960 (when the modern tide record begins), much too short a time for such a large sea level rise. For these reasons, there is every possibility that the height of 12.43 ft given in the 1946 station diagram was wrong. The document was almost certainly wrong about the 30-year reference period, and given that its authorship and methodology is unknown, there is no pressing reason to believe the figure of 12.43 ft either. The data from the old tide gauge pre-1905 is no help either as it's zero reference height is unknown. One side issue for the accuracy of the pre-1905 `state datum' is that the very years in question include some severe El Niño years, three of which 1888, 1896 and 1905, were more severe than the well-known 1982-83 and 1997-98 events. El Niño has the effect of depressing sea level by several centimetres at Hobart (discussed in `Isle of the Dead Revisited')[12] for the duration of the event, and so annual MSL would have been depressed in those years with a resulting low estimate of true MSL. (El Niño years are shown in red in this chart, the length of the bars indicating the intensity of the event. The blue bars show La Niña conditions, none of them particularly strong).
Conclusion Until such time as the old tide gauge zero can be determined, the old Hobart Marine Board datum (which only became the `state datum' in the 1940s), while adequate for land surveyors of the 1940s, cannot be regarded as validated from a scientific point of view. We only have its height above MSL expressed as a number, with no indication as to how it was determined, when, or by whom. Unlike the Shortt measurement of 1888, there is no `pedigree' by which we can validate the `state datum' today. Hunter et al's reference to some old departmental minutes from 1940 containing no details about mean sea level, is inadequate to support their claim of a sea level rise at Hobart. Their presentation of a 30-year spread of data, and calculated uncertainty ranges, from 1875 to 1889, is at odds with other information from several sources that systematic tide data collection at Hobart did not begin until December 1889. It would have been extremely difficult for any researcher living outside Tasmania to have tracked down the information provided here as the Hunter et al citation was of little value. It required some local knowledge and contacts to get beyond the reference and obtain the additional information necessary. It would be equally difficult for peer reviewers and international journal editors to do so. The fact that Geophysical Research Letters and their peer reviewers were necessarily unaware of this deficiency in the Hunter et al paper suggests that similar referencing problems could well exist in other scientific papers. With public policy being developed from claims made in such papers, the validation of these claims by the journals and peer reviewers needs much greater attention and scrutiny in the climate science field than is presently apparent. References [1]
J. Hunter, R. Coleman, D. Pugh, (2003), The Sea Level at Port Arthur, Tasmania, from 1841 to the Present [3]
Ross, Sir J.C., (1847), "A Voyage of
Discovery and Research in the Southern and Antarctic Regions, During [4] `Eight Bells' (1892), The Australasian, "Notes of a Yachting Trip", 6th Feb., p.281 [5] B. Hamon, (1985) "Early
Mean Sea Levels
and Tides in Tasmania", Search, vol.16,
No.9-12, Oct/Dec, [6] T. Lempriere, (1841-1842) "Register of Tides Kept at Port Arthur", from the Royal Society archives, London [7] Shortt,
Cmdr. J., (1889), "Notes on the
Possible Oscillation of Levels of Land and Sea in Tasmania During [8] The Permanent Service for Mean Sea Level, Online Tide Gauge Data [9] N. Bowden, Surveyor-General's office, Hobart, Tasmania, pers. comm. May/June 2003 [10] Government of Tasmania,
(1941), Report
and Proceedings of the Standing Committee of the Coordination [11] A.
Mault, (1889), On
Some Tide Observations at Hobart During February and March, 1889, Royal Society [12] J. Daly (2003), The Isle of the Dead Revisited, online article, Part 1 and Part 2 [13] K. Ridgeway, CSIRO, Hobart, pers comm. 5th June 2003 [14] Department of Primary Industries, Water, & Environment, Station Diagram for SPM-1371, Hobart, 1946 |
![]()
Fort Denison, Sydney Harbour, Australia
|
Fort Denison lies in the outer Sydney Harbour, New South Wales, Australia. Mean Sea Level is presented. The graph below shows monthly sea level since 1914 smoothed with a 12-monthly running mean to reduce monthly `noise'. Fort Denison with 82 years of data shows a sea level rise of +0.86 mm/yr (or 8.6 cm if taken over a full century). Data from the Permanent Service for Mean Sea Level. In a recent paper on the Isle of the Dead sea level benchmark at Port Arthur, Tasmania, struck in 1841 by Ross and Lempriere, Hunter et al (GRL, v.30, No. 7, 1401, April 2003) claimed that sea level had risen there by around 1 mm per year (or 10 cm over a full century), citing a comparison with Fort Denison and Fremantle in Western Australia as cross validation for their statistical study. According to Australia's National Tidal Facility, Fort Denison is only one of three tide gauges around the Australian coast to have more than 60 years of historic sea level data. The other two are Port Pirie in South Australia and Fremantle in Western Australia. Fremantle is the oldest (90 years), but because recent satellite measurements have shown Perth (near Fremantle) to be subsiding steadily, its 90-year tide gauge record cannot be used in sea level studies because the land subsidence creates an artificial sea level `rise'. Other tide gauges on the same coast as Fremantle show an average sea level fall over the last 30 years , further invalidating the Fremantle record. Here are the NTF figures in mm/yr, sea level rises indicated in red, sea level falls in blue -
Wyndham -0.59,
Port Hedland -1.32,
Carnarvon +0.24,
Geraldton -0.95, The average for all of them, including the errant Fremantle, is a sea level fall of -0.31 mm/yr. With Fremantle clearly invalid, that leaves only Fort Denison and Port Pirie of the three 60-year plus stations. On the face of it, Fort Denison's sea level rise would seem to support Hunter et al. But does it? A careful look at the plot of Fort Denison below shows that most of the sea level rise there took place in a 3-year period between 1948 and 1951 when an apparent stepwise rise in long-term sea level, of about 6 centimetres, occurred. This is impossible physically. Sea level cannot simply rise 6 cm in three years from one long-term level to another higher level. It is also unlikely to be caused by land subsidence as that too is a slow cumulative process as happens at Fremantle, not a sudden step action. Earthquakes or tremors could cause it - if severe or numerous enough - (such as the 1,000 tremors which happened in eastern Tasmania during the early 1880s, and which may have affected sea level at the Isle of the Dead during that period). But that seems very unlikely in the case of Sydney Harbour. That leaves instrumentation problems as the only viable explanation for the sudden datum shift around 1948-51. Such datum shifts caused by instrument problems are very common with tide gauges, such as those of Hobart shown here. Simple fouling by sea weed, marine growths and debris is all it takes to skew readings from a tide gauge. Relocation or instrument replacement can also cause such shifts.
But suppose Hunter et al. was right and that the Fort Denison datum shift was a genuine sea level rise and not an artifact of instrument problems. Such a large sea level rise could not go un-noticed at the other long-term tide gauge in Australia - Port Pirie in South Australia
|
![]()
Return to `Still Waiting for Greenhouse' main page