![]()
The additional IR absorption for CO2 doubling is the energy source for global warming. HITRAN transmission spectra – the fringes being by no means saturated yet – can be used to evaluate this absorption, mostly occurring near ground. A simple radiative energy equilibrium model of the troposphere yields an IPCC-conforming radiative forcing which is here defined as the additional energy re-radiated to ground. Coping with water vapor overlap on the low frequency side of the 15 µm band, the clear sky CO2 forcing is considerably reduced to 1.9 W/m². With vapor feedback and for cloudy sky the ground warming will be about 0.4 to 0.6 °C only – a factor 4 to 6 less than IPCC's 'best guess'.
The radiative forcing caused by a prescribed doubling of the pre-industrial (or present or any) CO2 concentration is the imbalance in the Earth's radiation budget that is supposed to cause global warming. More CO2 means more absorption of the infrared (IR) re-radiation which the Earth emits to space to compensate for the solar short wave irradiation. To restore the radiative equilibrium between warming and cooling, the average 15 °C ground which sends most of the thermal black body Planck emission directly to space, has to warm up slightly until the withheld energy – i.e. in our definition the increased back-radiation – is re-emitted.
The IPCC used the following definition, focusing on topopause level conditions:
"The radiative forcing of the surface-troposphere system (due to a change, for example, in greenhouse gas concentration) is the change in net (solar plus longwave irradiance) in W/m² at the tropopause AFTER allowing the stratospheric temperatures to re-adjust to radiative equilibrium, but with surface and tropospheric temperature and state held fixed at the unperturbed values".
The often quoted additional absorption for CO2 doubling within the troposphere is not the forcing itself, as formerly often (mis)understood by non-specialists, but it is the source of the (thermal) re-emission to ground which is based on the atmospheric energy equilibrium. This means, the re-emission at tropopause level plus the re-emission to ground (which causes the warming) is equal to the additionally absorbed energy.
Using HITRAN-1996 CO2 transmission spectra from Jack Barrett, an Excel diagram (Fig.1) was prepared for a range of 300 cm^-1 and 560 intervals. It shows the transmission, i.e. the intensity ratio T=I/Io of an IR beam travelling from ground to the top of the troposphere, which would be a layer of 6800 m for ground pressure. T depends strongly on the wavenumber per cm (for example 15 µm means a wavenumber of 1/15*10^4=667/cm). The area of the integrated absorption A=1-T of the yellow spectrum for the total troposphere (without coping with water vapor) is 196 cm^-1. This is about 74 W/m² when multiplied with a medium Planck radiation of 0.38 W/m²/cm^-1 for 288 K in the range around 15 µm. The exact method would be to take the A value of each interval, multiply with the interval length (here 15/28 cm^-1) and with the individual Planck radiation at the interval, and integrate over the whole range, here 560 intervals. The residual area in Fig.1 (difference between the yellow (1*CO2) and green (2*CO2) spectra = CO2 doubling absorption) was integrated to 16.8 cm^-1, which is 6.4 W/m² when multiplied with the Planck radiation.
This absorbed energy depends very little on the layer thickness (optical density) and is thus not at all sensitive to the accuracy of absorption within the troposphere (which was here simply powered up according to the Lambert-Beer law, based on a 139 m equivalent probe, to show the layer characteristics). The red spectrum for a 1000 m layer (related to ground pressure) is quite exactly the same as the one published by E. Raschke et al. [see H. Hug, Chemische Rundschau (19 Feb 1999)]. Though no adaptions for pressure or temperature changes in the atmosphere were made, the residual result was within 0.1 W/m² conforming with another data set for the whole troposphere. Let us assume the residual absorption for CO2 doubling to be 7.4 W/m² in total, coping with the missing part of the yellow and green spectra at the left and right side of the diagram – here considering as well the missing hot bands around 960 und 1064 cm^-1.
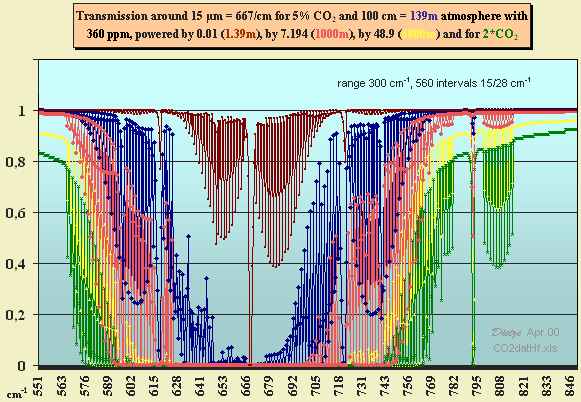
Fig. 1: HITRAN transmission diagram based on data for 5% CO2 and 100 cm at ground pressure
The absorbed radiation is nearly completely thermalized and dissipated (acc. to J. Barrett and H. Hug). In thermal equilibrium this energy is re-radiated by atmospheric components as CO2 (double density yields double emission for the same temperature) and partly by other GHGs – the latter only in case the temperature profile shifts, contradicting the IPCC definition. In this case convective and latent heat processes would become involved in additional vertical energy transport. All these have to end up in thermal re-emission at tropopause level, directed to both sides, space and ground. Whereas the lower atmosphere warms, the upper atmosphere is cooling (thus increasing the lapse rate) – here doubled CO2 takes over a part of the emission from the other GHGs.
As all re-emission has to be considered as being bidirectional, we can assume in first approximation that half the total re-emission goes to space and half goes to ground. So we yield the new (by 15% reduced) IPCC TAR forcing of 3.7 W/m², as shown in Fig.2. But the emission depends on the 4th power of the absolute temperature. So if we assume the bulk radiation temperature near ground (500m) as 285 K and in the upper troposphere (5500m) as 255 K, the upper emission should be only 64%. On the other hand we find very little water vapor in the upper troposphere, whereas the vapor near ground considerably absorbs the CO2 emission. As we have a mixture of up and down radiation, absorption and thermal re-emission, and only the sum of re-radiation is known, the correct ratio of the two emissions cannot easily be determined. So it seems reasonable to assume that the total emission is split about 1:1.
Important to mention that IPCC's forcing for clear sky conditions is meant for well mixed GHGs, i.e. without water vapor overlap [G. Myhre, J. Highwood, P. Shine, F. Stordal in Geophs. Res. Letters 25, 2715-2718 (July 15, 1998)]. IPCC argues that at tropopause level the water vapor density is negligible, which is true – but in reality the forcing stems from absorption and back-radiation within the lower troposphere near ground where we find the bulk of water vapor. As by vapor overlap here practically the low frequency part (i.e. about 50%) of the radiative forcing residual is cancelled (see below), we take 1.9 W/m² as radiative forcing (Fig.2).
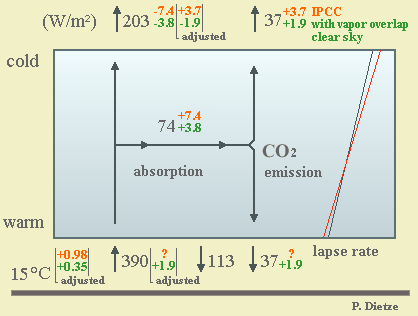
Fig. 2: Radiative fluxes and forcing for CO2 doubling, atmospheric thermal equilibrium model
Now the IPCC errors become very obvious. Using the former forcing of 4.3 W/m² for tropopause level, application of the differential form of the Stefan-Boltzmann law dT/T=1/4*dS/S, with S=240 W/m² and T=255 K, yielded a temperature increment of dT=1.14 K (which is now reduced to 0.98 K with 3.7 W/m²). The IPCC assumed that this increment would be transmitted 1:1 down to the ground, based on a constant lapse rate. Because water vapor is a strong greenhouse gas, the IPCC then used a factor of 2.2 as the effect of water vapor feedback – neglecting that on the other hand vapor should also reduce the radiative CO2 forcing – and thus obtained a warming of 2.5 °C for CO2 doubling, the 'best guess' – so called by T. Wigley and S. Raper in a review paper [Nature 357, 293-300 (1992)]). D. Rind titled his article about the feedback approach "Just add Water Vapor" [Science 281, 1152 (21 Aug 1998)].
But as observations did not support the exaggerated warming, the IPCC assumed, the discrepancy was an effect of aerosol cooling while other effects (e.g. amplification of solar forcing) were considered to be insignificant. Their exaggerated aerosol cooling and the gain in parameter variability was ideal to maintain a far too high CO2 climate sensitivity, thus compensating for missing solar forcing amplification and any other model discrepancies, just as required.
Of course, the argument exists that the amount of near ground moisture will increase with warming, and water vapor is a strong greenhouse gas. This argument depends on IPCC's questionable assumptions of total transfer of the upper troposphere warming to the lower atmosphere, and a strong water vapor feedback. But here we have to consider a feedback damping because the more IR is absorbed around 15 µm by water vapor, the less remains for CO2 to be absorbed in the same overlapping bands, and the water vapor absorbtion capability is mostly saturated in this region of the IR spectrum, though not in other parts. According to a mean ratio of 1.34 between clear sky and cloudy sky forcing [Tab.1 and Tab.2 in G. Myhre et al. (1998), see above] we can adapt our forcing of 1.9 W/m² to 1.4 W/m² for cloudy sky condiditions. So at ground level and 288 K with 390 W/m², the radiative equilibrium warming of 0.35 K in Fig.2 has to be modified to 0.26 K, any water vapor feedback not yet being included. We follow R. Lindzen who claims a considerably smaller feedback and we assume a factor of about 1.6 (half of IPCC's). The ground warming would increase to about 0.42 K, a factor six less than IPCC's climate sensitivity.
Btw., the solar fraction analysis sensitivity is by a factor three less than IPCC's 2.5 K. If we would assume a factor 2.2 for water vapor feedback, our doubling sensitivity would become 0.57 K, still 33% less than the solar fraction analysis figure. These values do not require an assumption of enforced aerosol cooling because they provide better agreement with observations than IPCC's 'best guess' sensitivity. Additionally, a CO2 doubling can hardly occur because of increasing sink flows and limited fossil reserves. Even if 1.500 GtC would be burnt until 2100 according to the business as usual scenario IS92a (instead of the reasonable estimate of 1.300 GtC that could and would be used), the concentration would only increase to about 570 ppm (see Tab.1 in this German carbon model paper – for 1.300 GtC burnt by 2090, the concentration only reaches 548 ppm). Therefore, the harmless temperature increment from doubled CO2 concentration is a probable maximum rise in mean global temperature from anthropogenic CO2 greenhouse effect.
As most of the absorption for CO2 doubling occurs near ground – a doubling test for 139 m already yielded 6.5 W/m² (88% of 7.4 W/m²) – the water vapor overlap should mostly cancel the left residual (and btw. some fraction of the right one as well). H. Fischer has shown this in a graph of a position paper of the German Meteorological Association (DMG), which advocates the greenhouse effect. The "residuals" are the differences in transmission between 1*CO2 and 2*CO2 (Fig.3). We can estimate the cm^-1 area of the right residual (the left was cancelled because the water vapor transmission is very small here) and multiply with the associated Planck radiation per cm^-1. The radiative clear sky forcing represented by this DMG residual is 1.7 W/m² only, of which 0.3 W/m² stems from the hot band around 960 cm^-1. So our 1.9 W/m² forcing in Fig.2 is likely. H. Fischer used HITRAN data and apart from water vapor overlap he coped with other greenhouse gases and with thermal CO2 emission depending on atmosphere temperatures.
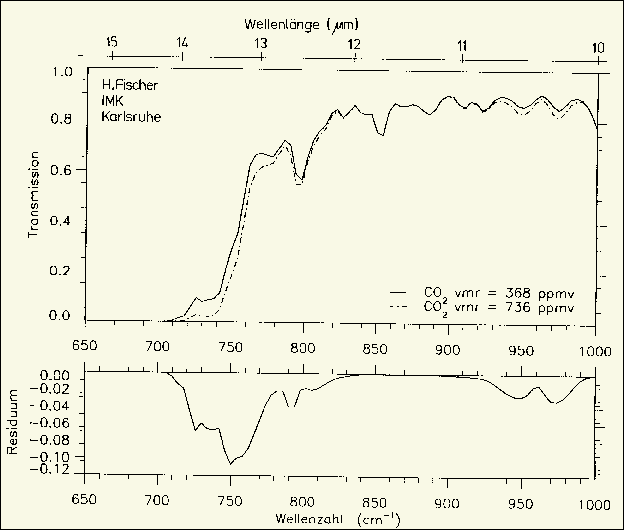
Fig. 3: German DMG residual (H. Fischer, IMK Karlsruhe 1999)
IPCC authors so far refused to disclose details about the modelling assumptions and computation of their core parameter, demanding us to believe in their results – which is an unprecedented offence against rules in public funded science, and the TAR again follows this line. A graph about radiative forcing of the 1994 IPCC report is shown in Fig.4. As the left residual is not cancelled, here obviously water vapor overlap has hardly been considered, contrary to the statement in the note on p.174 and the approach of H. Fischer. Each residual area in W/m² from net irradiance at tropopause level roughly matches the one in Fig.3 when logarithmically adapted to CO2 doubling, though IPCC claims having even coped with cloud effects. R.D. Chess et al. state in [Uncertainies in CO2 Radiative Forcing in Atmospheric GCMs, Science 262, 1252 (19 Nov 1993)] "The forcing is substantially reduced through radiative overlap of the CO2 absorption bands by the absorption of water vapor" and "Clouds also reduce the forcing".
Surprisingly the IPCC residuals (Fig.4c) come together at 15 µm, whereas in Fig.3 they would be about 70 cm^-1 apart from each other. The IPCC residuals were calculated with radiative transfer equations, using the standard narrow band code of P. Shine 1991 - both not been published by IPCC and obviously available within the 'community' only. Residuals show a broad gap inbetween when only absorption is considered. Coping with thermal emission, they are shifted towards the 15 µm center – the more, if only a fractional layer (e.g. upper troposphere) is evaluated. Their area (which is important) keeps mostly unchanged.
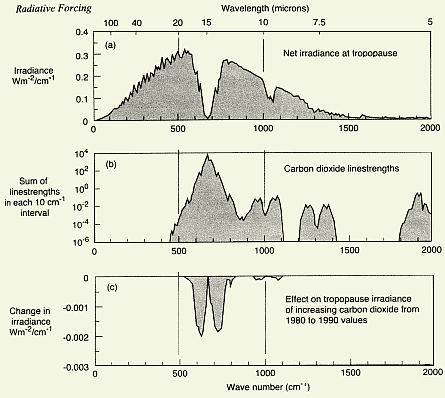
Fig. 4: IPCC 1994 p.175 radiative forcing figure 4.1
The linestrengths in Fig.4b are not explained and easily misinterpreted. The data from HITRAN (high resolution transmission molecular absorption database by L.S. Rothman et al.) are extinctions (line intensities or linestrengths) given per CO2 molecule for each individual peak wavenumber. The resolution is extremely precise, about 0.0005 cm^-1. To cope with the optical density, the molecular extinction is multiplied by the number of molecules (the troposphere contains about 4.1 kg CO2/m²). The lines are then integrated over an interval (e.g. 1/560 of the diagram range of 300 cm^-1, see Fig.1), coping with the peak shape, pressure broadening and temperature dependency. IPCC's linestrengths in Fig.4b are extinctions E=-log(T) for the whole troposphere, integrated over 10 cm^-1 for smoothing purposes, and divided by ten (the integration interval) to get cm^-1 related values. To prepare transmission diagram data, each interval T value is calculated as T=10^-E for the specific wavenumber (which is done by HITRAN). As T is a nonlinear function of E, the smoothing of E may have some effect on T. H. Hug proved the HITRAN assumption to be flawed, that nitrogen is neutral with respect to the IR absorption of CO2 [CHEMKON 7, 6-14 (Jan 2000)]. With presence of atmospheric N2 the IR absorption increased to double (!) of the one for CO2 alone in a lab measurement.
Using the triangular section of IPCC's linestrengths in Fig.4b between 450 and 900 cm^-1, the decadal exponent of E can be expressed as two linear functions of the wavenumber. So transmissions have been calculated analytically in order of a comparative test for the tropospheric 6800 m layer (at ground pressure) and a layer of 2.5 m only, as well as residuals for CO2 doubling absorption (without thermal emission). In Fig.5 the obtained diagram is shown for a wavenumber range of 400 cm^-1, with 560 intervals of 5/7 cm^-1 each.
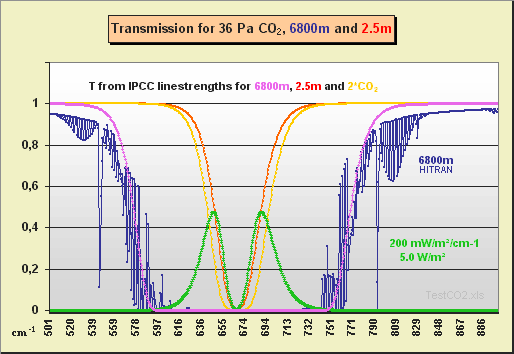
Fig. 5: Transmission and absorption calculated using IPCC 1994 linestrengths
The purple T curve computed from IPCC's linestrengths, fits the bulk of the blue 6800 m HITRAN transmission spectrum (except for the outer ranges). The green residual curve for additional absorption for CO2 doubling within the very thin 2.5 m layer looks similar to what IPCC had calculated for the forcing at tropopause level. The unit is 200 mW/m²/cm^-1, the 2*CO2 residual absorption for the 2.5 m layer is already 5.0 W/m².
In Fig.4a IPCC did not correctly model the emission characteristic to be seen in satellite measurements (satellite spectrum here) which does not show a zero emission at the bottom of the funnel around 15 µm, but a thermal emission of about 0.12 W/m²/cm^-1 (any steradian-related figure has to be multiplied by p though one would expect it to be 2p). This left out emission – it is about 4 W /m² for the 1*CO2 base case – results in a too high radiative forcing as it causes an increased part of the radiative energy being withheld at tropopause level in case of CO2 doubling.
For a long time we had a controversial discussion about discrepancies between satellite MSU measurements (about 1-5 km height, indicating hardly any warming trend), and ground station readings, see as well http://www.john-daly.com/graytemp/surf-msu.htm#Dietze1. Using IPCC's flexible aerosols, Ben Santer, Tom Wigley et al. tried to model-experiment away and downplay this problem [Science 287, 1227-1232 (18 Feb 2000), see as well D.E. Parker on p.1216]. The warming effect from radiative CO2 forcing occurs mostly near ground. So the GCMs which assume a parallel shift of the troposphere temperature profile (as e.g. J.F.B. Mitchell and Sir John Houghton formerly stated), instead of coping with an increased lapse rate (Fig.2), erroneously assume a well and fastly mixed troposphere.
Even the TAR draft Ch.6 p.6, line 52-54 still says that surface and troposphere are closely coupled, the thermal structure being determined by a nominal lapse rate, all thus behaving as a single thermodynamical system. Because of the increasing lapse rate satellites measure a mix of cooling and warming and thus can principally not replicate the ground temperature trend.
Even if most of the error sources in ground temperature series (not to forget ocean measurements) would be eliminated, the trend should still not be (mis)used as a "proof" for the correctness of the CO2 sensitivity parameter the IPCC model results were based on. The estimation of radiative forcing done here and previously in the solar fraction analysis show that the CO2 climate sensitivity has indeed to be reduced considerably, just resulting in a rather harmless (if not beneficial) warming till 2100 – when fossil reserves become rare and mankind may turn to bulk power production from thorium breeders and fusion reactors anyway.
17 April 2000, Dipl.-Ing.
Peter Dietze
Phone & Fax: +49/9133-5371
e-mail: 091335371@t-online.de
this paper: http://www.john-daly.com//forcing/forcing.htm
![]()
Comments and reviews on the above paper are
available at the following link:
`Open Review'
![]()
Return to Climate Change Guests Papers Contents Page
Return to "Still Waiting For Greenhouse" Main Page